

A single hour of downtime now costs over $300,000 for most mid-size and large businesses. So what is high availability, and why does it matter this much?
High availability is the practice of designing systems that stay operational with minimal interruption, typically measured in “nines” of uptime (99.9%, 99.99%, or higher). It’s built on redundancy, automated failover, and continuous monitoring across every layer of your infrastructure.
This guide covers how high availability works, the architecture patterns behind it, how major cloud platforms like AWS, Azure, and Google Cloud implement it, and the real tradeoffs involved in chasing more nines. You’ll also learn how to measure system uptime, identify common causes of outages, and build systems that recover automatically when things break.
What is High Availability

High availability is a design approach that keeps systems, applications, and services running with minimal interruption. The goal is continuous operation, measured as a percentage of uptime over a given period.
A system qualifies as “highly available” when it delivers 99.9% uptime or better. That number sounds close to 100%, but the gap matters more than you’d think.
The difference between 99.9% and 99.999% availability is the difference between 8 hours and 46 minutes of downtime per year versus just 5 minutes and 15 seconds. Each additional “nine” shrinks the acceptable outage window dramatically.
Here’s how the math breaks down:
| Availability Level | Common Name | Annual Downtime |
|---|---|---|
| 99.9% | Three nines | 8 hours, 46 minutes |
| 99.99% | Four nines | 52 minutes, 36 seconds |
| 99.999% | Five nines | 5 minutes, 15 seconds |
ITIC’s 2024 research found that 90% of organizations now require a minimum of 99.99% availability for mission-critical systems. That’s up from 88% just two and a half years earlier.
Both planned and unplanned downtime count toward these numbers. Planned downtime includes maintenance windows and scheduled updates. Unplanned downtime covers hardware failures, software bugs, cyberattacks, and configuration mistakes.
The formula itself is straightforward: (Total Time – Downtime) / Total Time x 100. But reaching those numbers in production? That’s where things get tricky.
Every component in a system has its own failure rate. When components are arranged in series (one depends on another), their individual availabilities multiply together, which pulls the overall number down. Redundant components arranged in parallel push it back up. This is why high availability architecture focuses so heavily on eliminating single points of failure and building layers of redundancy into every part of the stack.
Why High Availability Matters
Downtime is expensive. Full stop.
ITIC’s 2024 Hourly Cost of Downtime survey found that over 90% of mid-size and large enterprises now report a single hour of downtime costs more than $300,000. And 41% put that figure above $1 million per hour.
Financial Impact of Outages
EMA Research’s 2024 analysis puts the average cost of unplanned downtime at $14,056 per minute across all organization sizes. That same research found a 60% increase in per-minute costs for companies with fewer than 10,000 employees.
These aren’t abstract numbers. The July 2024 CrowdStrike outage, caused by a single faulty software update, cost Fortune 500 companies an estimated $5.4 billion in direct losses, according to insurance firm Parametrix. Delta Air Lines alone reported roughly $500 million in damages.
And that was just 79 minutes of disruption.
Industries Where Downtime Hits Hardest
Healthcare: The CrowdStrike incident generated an estimated $1.94 billion in healthcare losses alone. Hospital systems can’t afford any gap in access to patient records or monitoring equipment.
Banking and finance: Real-time transaction processing means every second offline translates directly to lost revenue. Industry estimates put costs at roughly $12,000 per minute for major financial institutions.
E-commerce: A one-hour outage reportedly cost Amazon an estimated $34 million in sales. When your checkout page goes dark, customers don’t wait around.
Beyond Lost Revenue
The financial hit from outages extends beyond the immediate revenue drop. It includes recovery costs, regulatory penalties, and something harder to measure: trust.
Uptime Institute’s 2024 data shows that 70% of significant outages now cost organizations more than $100,000 each, up from 39% in 2019. The proportion of single incidents costing over $1 million has also grown steadily.
Service level agreements add contractual teeth to these stakes. When your SLA promises 99.99% uptime and you miss that target, the consequences go beyond service credits. Customers start looking at competitors. Took me a while to understand this early in my career, but SLA breaches compound over time. One bad month and the trust damage lasts way longer than the outage itself.
This is why availability isn’t just an infrastructure concern. It’s a business metric. And it’s also why the difference between functional and non-functional requirements matters so much during planning. Availability targets belong in requirements documents from day one, not bolted on after launch.
How High Availability Works

High availability comes down to one principle: no single component failure should take the whole system offline.
Achieving that requires redundancy at every layer, automated detection when something breaks, and fast recovery that doesn’t depend on someone manually stepping in at 3 AM.
Redundancy Across Layers
Redundancy means duplicating components so that backup resources take over when a primary fails. But it’s not just about having two servers instead of one.
A properly redundant system covers:
- Compute: Multiple application servers behind a load balancer that distributes traffic and detects unhealthy nodes
- Storage: Replicated databases with synchronous or asynchronous copies across nodes
- Network: Multiple network paths, redundant switches, and diverse ISP connections
- Power: UPS systems, backup generators, and dual power feeds
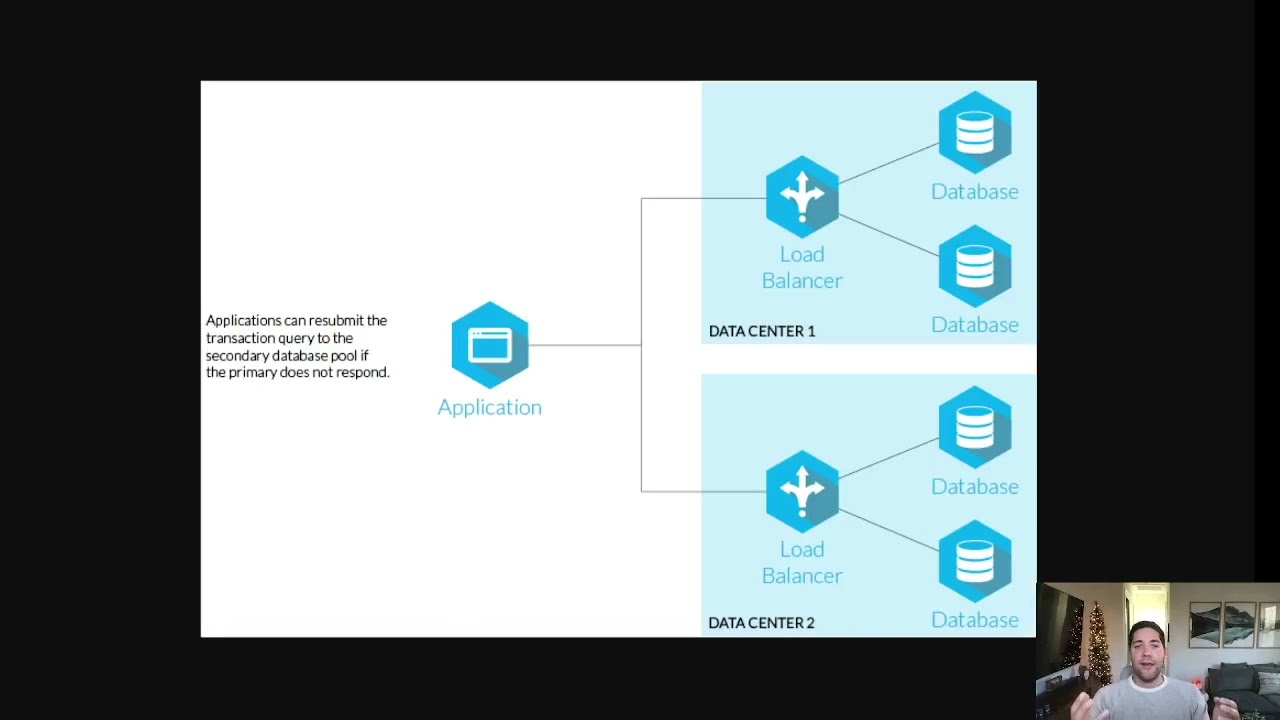
Geographic redundancy takes this further. Multi-region and multi-data-center setups protect against localized disasters. If an entire availability zone goes down (and yes, it happens), traffic routes to a healthy region automatically.
Uptime Institute’s 2025 Annual Outage Analysis confirms that power remains the leading cause of major outages, while IT and networking issues accounted for 23% of impactful outages in 2024. Redundancy across all these layers isn’t optional for serious availability targets.
Failover and Recovery
Redundancy alone isn’t enough. The system needs to actually switch to backup components when failure occurs, and it needs to do it fast.
Active-passive failover: A standby server sits idle until the primary fails, then takes over. Simple, but there’s a brief transition period.
Active-active failover: Multiple servers handle traffic simultaneously. If one drops, the others absorb its load with no switchover delay. More complex to implement, but recovery is nearly instant.
Two metrics define how well failover works:
- Recovery Time Objective (RTO) – how quickly you need to restore service
- Recovery Point Objective (RPO) – how much data loss is acceptable
Automated health checks run continuously, pinging servers every few seconds. When a node stops responding, the system reroutes traffic through DNS failover or floating IP addresses without waiting for a human to notice the problem.
Netflix built Chaos Monkey specifically because they understood this. If you don’t test failover regularly, you won’t know it works until you need it to. And that’s the worst time to find out it doesn’t.
The Role of Load Balancing
Load balancers sit between users and your servers. They distribute incoming requests, monitor server health, and remove unhealthy nodes from the pool automatically.
Layer 4 balancers route traffic based on IP address and port. Layer 7 balancers inspect application-level data and can make smarter routing decisions based on URL paths, headers, or cookies.
Global Server Load Balancing (GSLB) extends this across regions. Tools like Amazon Route 53 or Cloudflare route users to the nearest healthy data center based on latency, geography, or health check results. If your US-East region goes down, GSLB sends traffic to US-West within seconds.
High Availability vs. Fault Tolerance vs. Disaster Recovery
These three terms get mixed up constantly. They’re related but they solve different problems.
| Approach | Goal | Downtime Tolerance | Cost |
|---|---|---|---|
| High Availability | Minimize downtime | Seconds to minutes | Moderate to high |
| Fault Tolerance | Zero downtime | None | Very high |
| Disaster Recovery | Restore after major failure | Minutes to hours | Varies |
High Availability vs. Fault Tolerance
High availability accepts that failures will happen and focuses on recovering quickly. There might be a brief interruption, maybe a few seconds, while the system switches to a backup component.
Fault tolerance goes further. It runs fully duplicated systems in parallel so that when a component fails, the system continues without any visible interruption at all. Think of aircraft flight control systems or medical life support equipment. Zero tolerance for any gap in service.
The tradeoff? Fault-tolerant systems cost significantly more. Every component is duplicated (sometimes tripled), and the complexity of keeping everything synchronized adds overhead.
Most web apps don’t need fault tolerance. High availability with fast automated failover is enough. Your users can handle a half-second blip during a node switch. But a stock exchange’s trading engine? That half-second matters.
High Availability vs. Disaster Recovery

Disaster recovery kicks in after a catastrophic event. A fire destroys a data center. A flood takes out an entire region. Ransomware encrypts everything.
Where high availability prevents most outages from happening, disaster recovery answers: “Okay, it happened. Now what?”
A solid disaster recovery plan includes offsite backups, documented recovery procedures, and defined RTO/RPO targets. It’s the safety net behind the safety net.
Most serious setups use all three together. High availability handles day-to-day failures. Fault tolerance protects the most critical components. Disaster recovery covers worst-case scenarios. Having a clear risk assessment matrix helps teams figure out which level of protection each system actually needs.
High Availability Architecture Patterns
Knowing why high availability matters is one thing. Building it is another. These are the patterns most production systems use.
Active-Passive and Active-Active Clusters
Active-passive keeps a standby node ready to take over. The passive node doesn’t handle traffic until the primary fails. It’s simpler to set up and works well for databases where you want a clean, single-writer model.
Active-active distributes workload across all nodes simultaneously. If one fails, the remaining nodes absorb the extra traffic. Better resource utilization, faster failover, but harder to manage state consistency.
The choice depends on your workload. Stateless services (like API servers) fit active-active well. Stateful services (like primary databases) often start with active-passive because managing write conflicts across multiple active nodes introduces its own set of problems.
Stateless Application Design
The easier it is to replace a failed server, the faster your system recovers. Stateless design makes this possible.
A stateless application doesn’t store session data on the server itself. Instead, it offloads state to external stores like Redis, a shared database, or client-side tokens. Any server in the cluster can handle any request, which means losing one server is just a capacity reduction, not a service outage.
This pattern aligns well with containerization and auto-scaling groups. Kubernetes or Docker Swarm can spin up replacement containers in seconds when health checks detect a failure. Combined with horizontal scaling, you get systems that self-heal automatically.
If you’re building a cloud-based application, stateless design isn’t a nice-to-have. It’s basically a prerequisite for any serious availability target.
Database High Availability
Databases are the hardest part of any high availability setup because they hold state. You can’t just kill a database server and spin up a fresh one like you can with a stateless API.
Primary-replica replication is the most common approach. One primary handles writes, and one or more replicas receive copies of the data. If the primary goes down, a replica gets promoted. Tools like Patroni (for PostgreSQL) or MySQL’s Group Replication automate this promotion process.
Multi-primary setups allow writes on multiple nodes simultaneously. CockroachDB and Amazon Aurora handle this natively. Galera Cluster does it for MySQL. The complexity is higher, but you eliminate the single-writer bottleneck.
Connection pooling through PgBouncer or ProxySQL adds another layer of resilience. These proxies manage database connections, handle failover transparently to the application, and prevent connection storms during node switches.
Your choice of approach should match your consistency and performance needs. Look, strong consistency with synchronous replication gives you zero data loss but adds latency. Asynchronous replication is faster but risks losing the last few transactions during failover. There’s no universally correct answer here.
Load Balancing Strategies

Different routing strategies serve different availability goals:
- Round-robin distributes requests evenly. Simple but doesn’t account for server health or capacity differences
- Least connections sends traffic to the node handling the fewest active requests. Better for uneven workloads
- Health-based routing checks each node before sending traffic. Failed health checks remove nodes from rotation instantly
Tools like HAProxy and NGINX handle this at the application layer. For multi-region setups, GSLB services from AWS, Azure, or Cloudflare route traffic globally based on latency and availability zone health.
The reverse proxy pattern often gets layered in here too. A reverse proxy can cache responses, terminate SSL, and absorb traffic spikes, all while keeping your application servers shielded from direct client connections.
How to Measure Availability
You can’t improve what you don’t measure. And with availability, the measurement method matters as much as the number itself.
The Availability Formula
The standard calculation is:
Availability % = ((Total Time – Downtime) / Total Time) x 100
If your service was down for 52 minutes in a month with 43,200 total minutes (30 days), your availability is 99.88%. That’s below four nines. Whether that’s acceptable depends entirely on your SLA commitments.
But raw availability percentages hide important context. Five minutes of downtime during a 3 AM maintenance window hits differently than five minutes during Black Friday checkout traffic.
MTBF and MTTR
Mean Time Between Failures (MTBF) measures how long a system typically runs before something breaks. Higher is better.
Mean Time to Repair (MTTR) measures how quickly you recover once something does break. Lower is better.
These two metrics together tell a more useful story than availability percentage alone. A system with a high MTBF and low MTTR is genuinely reliable. A system that technically hits 99.99% but achieves it through luck rather than good design will eventually surprise you.
Uptime Institute’s 2025 report found that 80% of data center operators believe better management and processes would have prevented their most recent outage. That’s an MTTR problem disguised as an availability problem, because most of these incidents were recoverable faster with better procedures.
Composite Availability
Real systems have multiple components. Measuring end-to-end availability means accounting for how those components interact.
Series components (each depends on the next) multiply their availabilities together. Two components at 99.9% each give you 99.8% overall. Three give you 99.7%. It adds up fast.
Parallel components (redundant backups) are calculated differently. Two components at 99.9% in parallel yield 99.9999%. That’s the math behind redundancy, and it’s why high availability systems stack parallel components wherever possible.
When you’re scoping out the software development process for a new system, composite availability calculations should happen early. They show you exactly which components are dragging your overall number down and where adding redundancy gives you the biggest return.
High Availability in Cloud Platforms

Every major cloud provider builds high availability features into their infrastructure. But the tools, naming conventions, and default configurations differ enough that choosing the wrong setup can leave gaps you didn’t expect.
Synergy Research Group data shows AWS held 30% of global cloud infrastructure spending in Q4 2024, with Azure at 21% and Google Cloud at 12%. Together they control over 60% of the market.
| Provider | HA Compute Feature | Load Balancing | Multi-AZ SLA |
|---|---|---|---|
| AWS | Auto Scaling Groups | Elastic Load Balancing | 99.99% |
| Azure | Availability Sets/Zones | Azure Traffic Manager | 99.99% |
| Google Cloud | Managed Instance Groups | Cloud Load Balancing | 99.99% |
AWS Availability Features
AWS organizes its infrastructure into Regions, each containing multiple Availability Zones (AZs). These are physically separate data centers with independent power and networking.
Deploying EC2 instances across at least two AZs activates the 99.99% SLA. A single EC2 instance only gets a 99.5% guarantee, which translates to about 3.6 hours of allowed monthly downtime.
Auto Scaling Groups replace unhealthy instances automatically. Route 53 handles DNS-level failover across regions. Amazon Aurora offers multi-region replication for database high availability.
Azure and Google Cloud
Azure uses Availability Sets (within a data center) and Availability Zones (across data centers in a region). Traffic Manager routes requests globally based on priority, performance, or geographic proximity.
Google Cloud takes a similar approach with regional managed instance groups and Cloud Load Balancing. Google’s private fiber network connects regions with low-latency links, which helps with synchronous replication between zones.
One thing worth knowing: SLA guarantees from all three providers are expressed as service credits, not actual uptime promises. If AWS goes down for an hour, you get a billing credit. You don’t get your revenue back. Designing for horizontal vs vertical scaling correctly across these platforms is what actually keeps your services online.
Common Causes of Downtime in Highly Available Systems

Even well-architected systems go down. Understanding what breaks them helps you build better defenses.
Human Error
Uptime Institute’s 2025 Annual Outage Analysis found that nearly 40% of organizations suffered a major outage caused by human error in the past three years. Of those incidents, 85% involved staff failing to follow procedures or flaws in the procedures themselves.
The proportion of outages caused by failing to follow procedures rose by 10 percentage points compared to the previous year. Staff shortages and rapid industry growth likely contribute to this trend.
Configuration mistakes during routine maintenance, bad deployments, and accidental deletions are all common. The 2024 CrowdStrike incident, which crashed 8.5 million Windows systems globally, was caused by a single faulty content update that wasn’t staged or gated before deployment.
Infrastructure and Software Failures
Power issues remain the leading cause of impactful data center outages, according to Uptime Institute. UPS failures, generator switchover problems, and grid instability all play a role.
IT and networking issues accounted for 23% of impactful outages in 2024. That’s an increase driven by growing complexity in hybrid and multi-cloud environments.
Cascading failures are especially dangerous. One overloaded service times out, causing retries that overwhelm the next service downstream, and suddenly the whole system is on fire. A well-designed microservices architecture with circuit breakers helps contain these failures before they spread.
Third-Party Dependencies
Your system is only as available as its weakest external dependency.
- DNS providers going down can make your entire service unreachable
- CDN outages affect content delivery globally
- Payment gateway failures block transactions even when your app works fine
Uptime’s 2024 data shows outages attributed to digital service providers increased year over year. Hyperscaler outages declined, likely thanks to investments in distributed failover, but third-party risk remains a blind spot for many teams.
Tradeoffs and Costs of High Availability

More nines cost more money. That’s the tradeoff nobody likes to talk about.
Infrastructure Cost at Scale
Going from 99.9% to 99.99% availability might double your infrastructure spend. Going from 99.99% to 99.999% could triple it again. Each additional nine requires more redundant components, more monitoring, more geographic distribution, and more engineering time to manage it all.
Gartner Peer Community research found that 62% of respondents cited fear of causing disruptions as a top challenge when adopting resilience testing practices. The complexity itself becomes a risk factor.
The CAP Theorem Constraint
The CAP theorem states that a distributed system can only guarantee two out of three properties: consistency, availability, and partition tolerance.
Network partitions are unavoidable in distributed systems. So the real choice is between consistency and availability when something goes wrong.
A banking application needs consistency. Showing a wrong account balance is worse than showing a brief error message. An e-commerce product catalog? Showing a slightly stale price for two seconds is better than showing nothing at all. Your mileage may vary, and that’s exactly the point.
Computer scientist Eric Brewer, who proposed the theorem, later clarified that modern systems should aim to maximize combinations of consistency and availability that make sense for each specific application, rather than treating it as a hard either/or.
Choosing the Right Availability Target
Not every system needs five nines. At least in my experience, teams waste significant budget chasing 99.999% for services where 99.95% would be perfectly fine.
The question to ask: what does one minute of downtime actually cost this specific service? For a payment processor handling $100 million daily, a minute of downtime represents roughly $70,000 in lost transactions. For an internal analytics dashboard, a minute of downtime is an inconvenience.
Match your availability target to business impact. Internal tools, staging environments, and non-revenue systems rarely justify the cost of five nines. Put that budget where it moves the needle.
Running a gap analysis between your current availability numbers and your actual business requirements can save you from over-engineering the wrong things.
Steps to Build a Highly Available System

Theory is useful. But at some point you have to actually build the thing. Here’s the practical sequence.
Define Availability Targets First
Start with the business, not the infrastructure. Talk to stakeholders, look at revenue impact models, and define what availability level each service genuinely needs.
Write those targets into a software requirement specification early in the project. Bolting on availability requirements after the architecture is set almost always leads to expensive rework.
Eliminate Single Points of Failure
Map every component in your system and ask: if this one thing dies, does the whole service go down?
- Single database server with no replica
- One load balancer with no backup
- A single DNS provider
- Application servers in one availability zone only
Each of these is a single point of failure. Fix them in order of blast radius, starting with whatever would cause the widest outage.
Automate Monitoring, Alerting, and Failover
Manual failover doesn’t work at scale. If a human has to SSH into a server to fix things at 3 AM, your MTTR is going to be terrible.
Automated health checks with tools like Prometheus detect failures within seconds. Automated failover through Kubernetes, AWS Auto Scaling, or database tools like Patroni reduces recovery time from minutes to seconds.
The monitoring layer feeds into your build pipeline and continuous deployment process. When a bad deployment causes errors, automated rollback mechanisms can revert changes before the outage spreads.
Testing for High Availability
Gartner Peer Community data shows that 59% of organizations have deployed chaos engineering, with another 33% in the process of doing so. The top reason for adoption? Increasing system complexity (cited by 68% of respondents).
Chaos engineering means deliberately injecting failures into production or pre-production environments to verify that your system recovers correctly. Netflix built Chaos Monkey for exactly this purpose, and tools like Gremlin, LitmusChaos, and AWS Fault Injection Service have made the practice accessible to smaller teams.
Half of respondents in the Gartner survey identified improving MTTR as the top benefit of chaos engineering, followed by uncovering system weaknesses (46%) and improving failure detection (44%).
Beyond automated chaos experiments, run tabletop exercises. Get your on-call engineers in a room, present a failure scenario, and walk through the response step by step. You’ll find gaps in your runbooks that no automated test can catch. Keeping your technical documentation current is half the battle here, because outdated runbooks are sometimes worse than no runbooks at all.
Combine this with a real software test plan that includes availability-specific test cases: failover tests, load tests under degraded conditions, and recovery time measurements. Post-incident reviews after every outage close the loop and feed improvements back into the system.
FAQ on What Is High Availability
What does high availability mean in simple terms?
High availability means a system stays running with little to no downtime. It’s built through redundancy, automated failover, and continuous health monitoring so users experience uninterrupted access to services.
What is the difference between high availability and fault tolerance?
High availability minimizes downtime by recovering quickly from failures. Fault tolerance eliminates downtime entirely by running fully duplicated systems in parallel. Fault tolerance costs more but allows zero interruption during component failures.
What are the “nines” of availability?
The nines measure uptime as a percentage. Three nines (99.9%) allows about 8 hours of annual downtime. Five nines (99.999%) permits only 5 minutes and 15 seconds per year.
Why is high availability important for businesses?
Downtime directly impacts revenue, customer trust, and SLA compliance. ITIC’s 2024 survey found over 90% of enterprises report a single hour of downtime costs more than $300,000. The financial risk makes availability a business-level concern.
What is an SLA in the context of high availability?
A service level agreement defines the uptime percentage a provider commits to delivering. Missing SLA targets typically triggers service credits. AWS, Azure, and Google Cloud all publish SLAs for their compute and database services.
How does load balancing support high availability?
Load balancers distribute traffic across multiple servers and detect unhealthy nodes automatically. If one server fails, traffic reroutes to healthy ones. This prevents a single server failure from taking down the entire service.
What is the role of redundancy in high availability?
Redundancy means duplicating components (servers, databases, network paths, power) so backups take over when a primary fails. Without redundancy at every layer, a single hardware failure can cause a complete outage.
Can you achieve high availability in the cloud?
Yes. Cloud platforms offer availability zones, auto scaling groups, managed database replication, and global load balancing. Deploying across multiple zones or regions on AWS, Azure, or Google Cloud is the standard approach.
What is the difference between RTO and RPO?
Recovery Time Objective (RTO) defines how fast you need to restore service. Recovery Point Objective (RPO) defines how much data loss is acceptable. Both metrics shape your failover and backup strategy.
How do you test a system for high availability?
Teams use chaos engineering to deliberately inject failures and verify recovery. Tools like Chaos Monkey, Gremlin, and LitmusChaos simulate outages in controlled conditions. Regular failover drills and load testing under degraded conditions round out the process.
Conclusion
Understanding what is high availability comes down to one thing: keeping your systems running when components inevitably fail. Every architecture decision, from database replication to multi-region deployment, serves that goal.
The right availability target depends on your business. Not every service needs five nines. Match your redundancy investments to actual revenue impact and SLA commitments rather than chasing numbers for their own sake.
Start by eliminating single points of failure. Build automated failover into your compute, storage, and network layers. Test recovery through chaos engineering before a real outage tests it for you.
Downtime costs keep climbing. MTBF and MTTR metrics give you the data to improve. Whether you’re running on Kubernetes, managing active-active clusters, or configuring health checks in your production environment, the goal stays the same: minimize disruption, recover fast, and keep users from ever noticing something went wrong.

- How to Use Claude Code in VS Code - August 20, 2026
- From Offshore Development Team to U.S. Office: What Tech Companies Need to Plan Before Expanding Stateside - August 20, 2026
- What Are the Best Kajabi Alternatives for Growing Your Online Business? - August 19, 2026


