
Your business targets sit somewhere in the future. Your current performance exists right here, today.
The space between those two points? That’s where gap analysis lives.
Organizations use this strategic planning method to measure discrepancies between actual results and desired outcomes. It identifies where you are, defines where you need to be, then maps the path to close that distance.
This guide breaks down what is a gap analysis, how different types apply across industries, and the step-by-step process for conducting one. You’ll learn which frameworks work best for performance measurement, strategic objectives, and workforce development.
The methodology transforms vague improvement goals into concrete action plans.
What is a Gap Analysis
Gap analysis is a strategic business method that compares current performance against desired performance.
Organizations use this framework to measure discrepancies between actual results and target goals across operational, strategic, financial, or performance dimensions.
Harvard Business School research: Professor Mike Tushman defines a gap as the difference between strategy and actual results.
This performance measurement technique identifies where resources fall short. Organizations deploy gap analysis to pinpoint improvement areas across workforce capabilities, market positioning, or process efficiency.
The process connects to project management frameworks through systematic evaluation of current state versus future state targets.
Why Organizations Conduct Gap Analyses
Skills deficiencies: Springboard 2024 data shows 70% of executives report their businesses suffer financially because workforces lack the right competencies.
McKinsey found 87% of companies worldwide face skill gaps or expect them within a few years. Extended job vacancies cost large organizations an average of $1 million annually, according to Indeed 2023 research.
Financial impact drivers:
- Revenue loss (24% of executives cite this)
- Limited innovation and growth (35%)
- Decreased productivity (27%)
- Higher recruitment costs (39%)
Springboard’s 2024 survey reveals 38% of leaders say the skills gap at their company has worsened in the last year.
Resource allocation optimization requires measuring performance variance. Gap analysis frameworks help businesses balance current capabilities against market competitiveness factors and strategic planning requirements.
Compliance needs drive gap analysis adoption. Organizations assess adherence to external regulations to avoid fines through systematic evaluation.
Types of Gap Analysis Methods
Different gap analysis approaches serve distinct organizational needs.
Performance Gap Analysis
Performance gaps exist when organizations underperform compared to goals, strategy, and measurable market results.
This method evaluates current performance levels against established KPIs and target metrics. Organizations measure variance between baseline results and desired outcomes through quantitative analysis.
Manufacturing companies track production output, quality metrics, and resource utilization rates. Service organizations monitor response times, customer satisfaction scores, and operational efficiency benchmarks.
Market Gap Analysis
Market opportunity identification: Examines unmet customer needs that existing products or services fail to address.
Competitive analysis reveals where competitors fall short. Organizations identify gaps in pricing, features, or customer service that create market entry opportunities.
Customer feedback collection through surveys, focus groups, and social listening uncovers pain points. Market research techniques including segmentation analysis pinpoint underserved user groups.
Dollar Shave Club identified overpriced razors as a market gap, creating a subscription model that disrupted the industry.
Skills Gap Analysis
Springboard 2024 findings show 75% of C-level executives report a skills gap in their organizations.
Data analysis and project management rank as the most in-demand capabilities, with 44% of leaders saying their companies need these competencies.
Technical skills in demand:
- AI and machine learning (36% of leaders)
- Software engineering
- Data analysis
- Cloud computing
Critical soft skills needed:
- Strategic thinking (57% of leaders)
- Problem-solving and decision-making
- Communication (46% of leadership)
PwC Global Workforce Survey 2024 reveals 45% of workers have learned new tech for their jobs, while 51% think their job skills will change in five years.
Strategic Gap Analysis
This approach evaluates the difference between strategic objectives and current organizational capabilities.
Leadership teams assess whether available resources, market position, and operational capacity align with long-term vision. Strategic planning integration requires examining competitive positioning, SWOT analysis results, and resource capability assessments.
Force by Mojio, a GPS fleet tracking provider, used strategic gap analysis to identify scalability issues in their app when targeting larger fleet customers. They immediately implemented changes that attracted and retained bigger clients.
Profit Gap Analysis
Financial gap analysis compares forecast profits to desired profits, revealing the planning gap.
Organizations measure revenue shortfalls, cost structure inefficiencies, and profitability metric discrepancies. Cash flow management analysis identifies timing gaps between receivables and payables.
The planning gap divides into three elements: usage gap (total market potential vs. current usage), product gap (segment positioning), and distribution gap (market coverage).
Compliance Gap Analysis
Organizations evaluate adherence to regulatory requirements, industry standards, and internal policies.
This process identifies where current practices fall short of ISO standards, GDPR requirements, or industry-specific regulations. Audit preparation involves documenting compliance status and developing remediation plans.
ISO 25010 and IEEE 830 standards provide frameworks for software quality and requirements specification compliance.
How Does Gap Analysis Work

Gap analysis follows a systematic process from current state assessment to action plan implementation.
Process flow:
- Define scope and objectives
- Assess current performance
- Establish desired future state
- Identify and quantify gaps
- Determine root causes
- Develop action plans
- Implement and monitor
Current state assessment requires data collection from multiple sources. Organizations gather performance metrics, stakeholder feedback, financial reports, and operational data.
Measurement techniques include quantitative analysis (numbers, percentages, ratios) and qualitative analysis (interviews, observations, surveys).
Future state definition: Organizations establish clear, measurable targets based on industry benchmarks, competitive analysis, and strategic objectives.
Root cause analysis techniques identify underlying factors creating performance discrepancies. Organizations employ fishbone diagrams, five-whys methodology, or Pareto analysis to uncover contributing factors.
Lululemon’s leadership identified inconsistent store design as a gap affecting brand equity. They reworked leadership priorities and directives to store management for more consistent scaling.
Gap Analysis Framework Components
Each framework component serves a distinct purpose in measuring organizational performance.
Current State Analysis
Organizations document existing performance levels through data gathering and stakeholder input.
Data collection methods:
- Performance dashboards and KPIs
- Financial statements and reports
- Customer feedback and surveys
- Employee assessments
- Process documentation
- Market share data
Internal feedback from teams provides qualitative insights. Software development teams track code quality metrics, deployment frequency, and bug rates.
Baseline measurement establishes reference points for comparison. Organizations capture snapshots of current capabilities, resource allocation, and output levels.
Future State Vision
Defining success requires specific, measurable objectives aligned with business strategy.
Vision statements articulate desired market position, customer base expansion, and innovation frameworks. Organizations set quantifiable targets such as revenue growth percentages, market share goals, or customer satisfaction scores.
Industry benchmarking identifies best-in-class performance standards. Competitive analysis reveals what top performers achieve in similar markets.
Gap Identification
Variance measurement: Calculate the difference between current metrics and target metrics.
Organizations prioritize gaps based on business impact, resource requirements, and strategic importance. A manufacturing company might discover a 22% gap between current production efficiency (78%) and target efficiency (100%).
Documentation includes gap size, affected areas, and potential business consequences. Teams create visual representations through charts, graphs, or matrices.
Impact Assessment
Severity ranking: Organizations evaluate how each gap affects business performance and strategic objectives.
Financial impact analysis estimates revenue loss, cost increases, or profitability reduction. Operational impact measures productivity decreases, quality issues, or customer satisfaction declines.
Risk assessment identifies which gaps pose immediate threats versus long-term concerns.
Priority Ranking
Not all gaps require immediate attention or equal resources.
Organizations use frameworks like urgency-importance matrices or weighted scoring models. Criteria include financial impact, strategic alignment, resource availability, and implementation complexity.
High priority indicators:
- Direct revenue impact exceeding $500K annually
- Customer satisfaction scores below 70%
- Compliance violations with legal consequences
- Market share loss to competitors
Action Planning
Converting gap analysis findings into executable initiatives requires structured planning.
Solution identification involves brainstorming corrective actions, evaluating alternatives, and selecting optimal approaches. Teams assign ownership, establish timelines, and allocate budgets.
Resource requirements include personnel, technology investments, training programs, or process redesign efforts.
Implementation Roadmap
Timeline creation: Break down action plans into phases with specific milestones and checkpoints.
Organizations establish governance structures for monitoring progress. Weekly or monthly reviews track implementation status against planned schedules.
Agile methodologies from software development apply to gap closure initiatives. Sprint-based execution allows teams to adapt based on early results.
Measurement Systems
Tracking mechanisms ensure gap closure progress remains visible and accountable.
Performance indicators:
- Leading indicators (predictive measures)
- Lagging indicators (outcome measures)
- Milestone completion rates
- Budget variance tracking
Dashboard tools provide real-time visibility into initiative status. Automated reporting reduces manual tracking burden while maintaining transparency across stakeholder groups.
Performance Gap Analysis
Performance gap analysis compares actual output against target metrics to identify operational deficiencies.
Manufacturing operations track production efficiency, quality rates, and resource utilization. A factory producing 700 units instead of a target 1,000 units faces a 30% performance gap requiring immediate attention.
Key measurement areas:
- Output volume vs. planned production
- Quality metrics and defect rates
- Cycle time and throughput
- Resource efficiency percentages
- Customer satisfaction scores
Organizations document baseline performance through KPIs and operational dashboards. Performance tracking software provides real-time visibility into metric trends, allowing teams to spot deviations before they compound.
Root cause analysis reveals whether gaps stem from process inefficiencies, equipment limitations, or workforce capability issues.
NASA addressed skills gaps by creating a talent-mapping database to identify needed competencies across projects. This systematic approach aligned workforce development with mission-critical requirements.
Strategic Gap Analysis
Strategic gaps emerge when organizational capabilities fail to support long-term vision and competitive positioning.
Harvard Business School research shows opportunity gaps differ from performance gaps. Performance gaps signal current underperformance, while opportunity gaps indicate unrealized potential in emerging markets or technologies.
Analysis components:
- Competitive positioning assessment
- Market share analysis vs. targets
- Resource capability evaluation
- SWOT analysis integration
- Strategic objective alignment
Leadership teams examine whether available resources, market position, and operational capacity match vision statements. Discrepancies between strategic plans and execution capacity require intervention.
Lululemon identified inconsistent store design as a strategic gap affecting brand equity in 2005. CEO Christine Day reworked leadership directives to store management, creating more consistent branding for scale.
PwC June 2024 Pulse Survey found 73% of industrial-product leaders believe their average competitor will be out of business within 10 years without operating model reinvention.
Market Gap Analysis
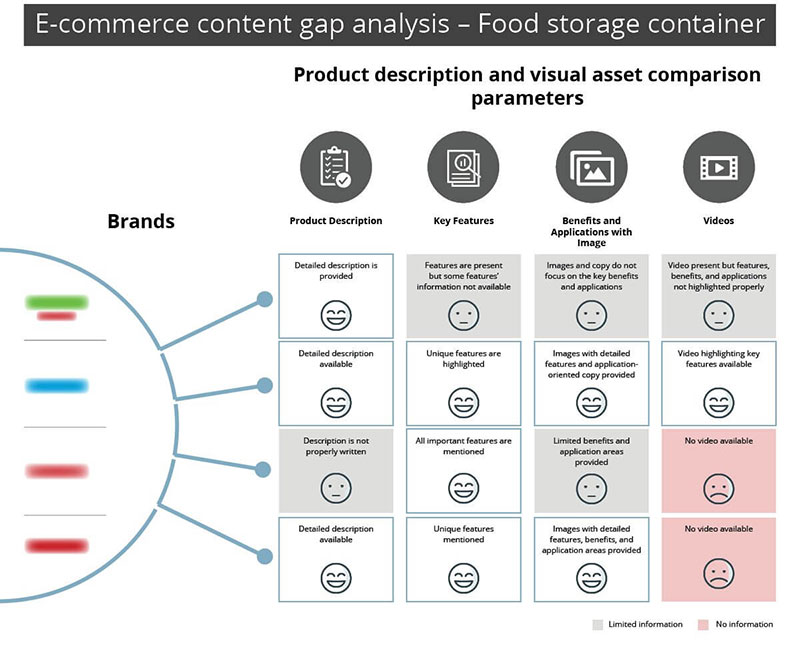
Market gaps represent unmet customer needs that existing products or services fail to address.
Businesses analyze customer feedback, competitor offerings, and industry trends to identify positioning opportunities. Market research techniques including surveys, focus groups, and behavioral analysis reveal pain points.
Airbnb spotted a gap between travelers seeking affordable accommodation and homeowners with unused space. Connecting these groups created a new hospitality category worth billions.
Identification techniques:
- Patent analysis reveals innovation areas and opportunity spaces where few solutions exist
- Customer complaint tracking uncovers consistent pain points
- Competitor weakness mapping shows where rivals underserve segments
- Trend monitoring spots emerging needs before mass adoption
Dollar Shave Club identified overpriced razors and inconvenient purchasing as market gaps. Their subscription model disrupted a category dominated by established brands.
Slack simplified workplace communication by replacing endless email threads with centralized messaging. This clear market gap became a multi-billion dollar opportunity.
Skills Gap Analysis for Organizations
Workforce competency assessments reveal discrepancies between current capabilities and future business needs.
Critical findings from 2024 research:
Springboard data shows 44% of leaders need data analysis skills in their companies. AI and machine learning rank third among sought-after technical capabilities at 36% of leaders.
Assessment methodology:
- Inventory current workforce skills and certifications
- Define future skills based on strategic objectives
- Measure proficiency gaps across teams
- Prioritize training investments by business impact
- Track skill development progress
PwC Global Workforce Survey 2024 reveals 51% of workers think their job skills will change in five years. Yet only 6% of companies have trained over a quarter of their workers on AI.
Organizations deploy competency frameworks to map skills systematically. Skills matrices visualize team capabilities against role requirements, highlighting development priorities.
Manufacturing skills gaps affect 600,000 job openings currently, with 3.8 million more expected by 2033 according to industry research.
Upskilling deepens existing employee capabilities. Reskilling expands abilities to perform different roles. Cross-training prepares employees for multiple positions.
Training employees costs less than external hiring. Internally filling hard-to-fill roles allows backfilling from wider candidate pools.
Conducting a Gap Analysis: Step-by-Step Process
Systematic execution ensures gap analysis delivers actionable insights rather than theoretical observations.
Define Analysis Scope and Objectives
Boundary setting: Specify whether analysis covers entire organization, single department, specific process, or individual project.
Clear scope prevents analysis paralysis. A retail company examining customer satisfaction should define whether analysis includes all touchpoints or focuses on in-store experience only.
SMART goal frameworks ensure objectives are Specific, Measurable, Achievable, Relevant, and Time-bound. “Improve sales” lacks clarity compared to “increase Q3 revenue by 15% through enhanced customer retention.”
Stakeholder identification determines who provides input, who receives findings, and who implements solutions. Primary and secondary stakeholders have different engagement requirements.
Assess Current State
Data collection methods vary by analysis type and available resources.
Quantitative data sources:
- Financial reports and P&L statements
- Performance dashboards and KPIs
- Production output records
- Customer satisfaction scores
- Market share percentages
Qualitative data sources:
- Stakeholder interviews
- Employee surveys
- Customer feedback sessions
- Process observations
- Documentation reviews
Organizations must validate data accuracy before drawing conclusions. Inconsistent measurement methods or incomplete records produce flawed analysis.
Baseline documentation creates reference points. A manufacturing company records current production efficiency (78%), defect rates (3.2%), and cycle times (45 minutes per unit).
Define Desired Future State
Target specification requires balancing ambition with realism.
Industry benchmarking identifies best-in-class performance standards. A customer service operation might target 90% first-call resolution based on industry leaders achieving this metric.
Competitive analysis reveals what top performers accomplish. If competitors maintain 95% on-time delivery while your organization achieves 82%, the gap indicates improvement potential.
Target-setting criteria:
- Industry benchmarks and best practices
- Regulatory requirements or compliance standards
- Strategic business objectives
- Customer expectations and demands
- Historical performance trends
Vision statements should inspire while remaining achievable. “Become market leader” needs quantifiable metrics like “capture 25% market share within 18 months.”
Identify and Quantify Gaps
Variance calculation: Measure the numerical or qualitative difference between current state and desired state.
A technology company targeting $50 million annual revenue while generating $32 million faces an $18 million revenue gap (36% shortfall).
Prioritization matrices rank gaps by urgency and impact. High-impact, high-urgency gaps receive immediate attention and resources.
Visual representations through charts or graphs make gaps visible to leadership teams and operational staff.
Determine Root Causes
Surface-level symptoms differ from underlying causes requiring different interventions.
Fishbone diagrams (Ishikawa) organize potential causes into categories: Methods, Materials, Machines, Manpower, Measurements, and Mother Nature (environment).
Five-whys methodology drills down by repeatedly asking “why” until reaching fundamental causes. If sales declined, why? Marketing reduced. Why? Budget cuts. Why? Revenue shortfall. Why? Customer churn increased. Why? Product quality issues.
Root cause analysis techniques:
- Pareto analysis (80/20 rule) identifies vital few causes
- Process mapping reveals workflow bottlenecks
- Data analysis uncovers correlation patterns
- Stakeholder interviews capture qualitative insights
Extended job vacancies cost organizations an average of $1 million annually according to Indeed 2023 research, often traced to misaligned job requirements or insufficient compensation.
Develop Action Plans
Converting analysis into execution requires structured planning frameworks.
Solution identification process:
- Brainstorm multiple approaches
- Evaluate alternatives against criteria
- Select optimal solutions
- Define specific action steps
- Assign ownership and accountability
- Establish timelines and milestones
- Allocate budget and resources
Action plans detail who does what by when. “Improve customer service” becomes “Implement chatbot for 24/7 support (John, by March 15, $25K budget) and train support team on new protocols (Sarah, by March 30, $10K budget).”
Resource requirements span personnel time, technology investments, training programs, and process redesign efforts. Underfunded initiatives fail despite solid planning.
Implement and Monitor
Execution without tracking leads to drift and abandoned initiatives.
Project management frameworks provide structure for implementation. Agile sprints allow iterative progress with regular checkpoints.
Monitoring mechanisms:
- Weekly progress reviews
- Monthly performance dashboards
- Quarterly strategic assessments
- Real-time metric tracking
- Stakeholder feedback loops
Adjustment processes allow course correction when initial approaches prove ineffective. Rigid adherence to failing plans wastes resources.
Performance management software like balanced scorecards tracks multiple initiatives simultaneously. Automated alerts notify teams when metrics deviate from targets.
Manufacturing analytics software enables real-time gap tracking. Operations teams see how process changes affect output immediately rather than waiting for end-of-month reports.
Gap Analysis Tools and Techniques
Different frameworks serve distinct analytical needs and organizational contexts.
SWOT Analysis

Strengths, Weaknesses, Opportunities, and Threats analysis provides comprehensive strategic overview.
Internal factors:
- Strengths: Skilled workforce, strong brand, proprietary technology, financial resources
- Weaknesses: Outdated systems, limited market reach, high costs, talent gaps
External factors:
- Opportunities: Market expansion, technology adoption, partnership potential, regulatory changes
- Threats: New competitors, economic downturns, changing customer preferences, supply chain disruptions
SWOT works best for strategic planning, market entry decisions, and competitor analysis. Its simplicity makes it accessible to teams without specialized training.
Fishbone Diagrams
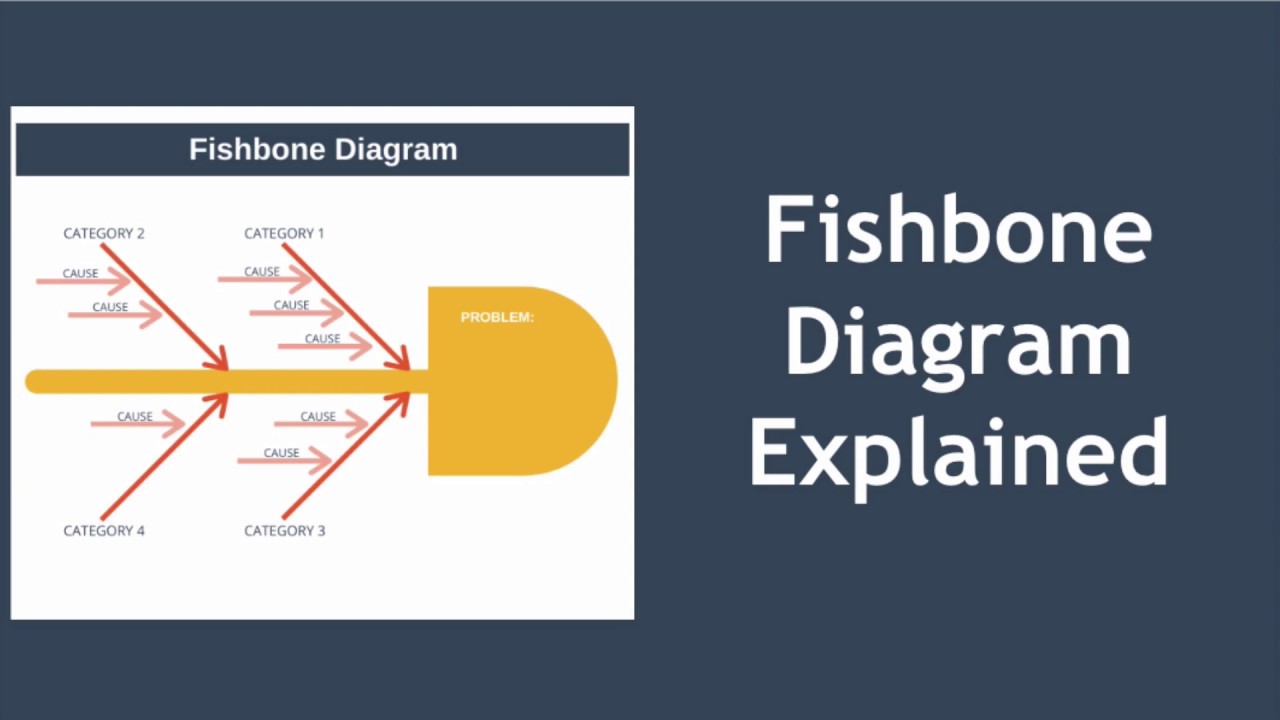
Ishikawa or cause-and-effect diagrams systematically identify root causes of problems.
Six M categories:
- Manpower: Workforce skills, training, motivation
- Methods: Processes, procedures, workflows
- Machines: Equipment, technology, tools
- Materials: Inputs, supplies, raw materials
- Measurements: Data collection, metrics, monitoring
- Mother Nature: Environmental factors, external conditions
Teams brainstorm potential causes under each category. Visual structure reveals relationships between contributing factors.
Quality management teams use fishbone diagrams extensively. Manufacturing defect analysis benefits from systematic cause categorization.
McKinsey 7S Framework

This model examines seven interconnected organizational elements for alignment assessment.
Hard elements (easier to define and measure):
- Strategy: Plans for competitive advantage
- Structure: Organizational hierarchy and reporting
- Systems: Processes and procedures
Soft elements (harder to define, culturally based):
- Shared Values: Core beliefs and organizational culture
- Style: Leadership approach and management style
- Staff: Personnel and capabilities
- Skills: Competencies and capabilities
All seven elements must align for organizational effectiveness. Misalignment in any area creates performance gaps.
A restaurant chain expanding from in-house production to importing products needs new teams (Structure), revised systems (Systems), additional hiring (Staff), and updated leadership focus (Style).
Nadler-Tushman Model

The congruence model focuses on inputs, transformation processes, and outputs to assess organizational effectiveness.
Four major components:
- Work: Tasks and activities
- People: Skills and needs
- Structure: Organizational design
- Culture: Values and norms
Higher congruence among elements produces better performance. Gaps emerge when components misalign.
Organizations analyze how inputs (environment, resources, history) transform into outputs (individual, group, organizational performance). Inefficiencies in transformation indicate improvement opportunities.
Balanced Scorecard
This performance management tool tracks multiple perspectives simultaneously.
Four perspectives:
- Financial (revenue, profitability, ROI)
- Customer (satisfaction, retention, acquisition)
- Internal Processes (efficiency, quality, cycle time)
- Learning and Growth (skills, innovation, culture)
Each perspective contains objectives, measures, targets, and initiatives. Balanced approach prevents overemphasis on financial metrics while neglecting operational health.
Benchmarking
Comparing organizational performance against industry leaders or direct competitors reveals competitive gaps.
Benchmarking types:
- Internal (across departments or locations)
- Competitive (direct rivals)
- Functional (similar processes in different industries)
- Generic (best practices regardless of industry)
Data sources include industry reports, competitor financial statements, trade associations, and research firms. Quantitative comparison identifies specific performance shortfalls.
A customer service center achieving 75% first-call resolution while industry average sits at 85% faces a clear performance gap requiring investigation.
PESTEL Analysis

Political, Economic, Social, Technological, Environmental, and Legal factors analysis examines external macro-environment.
Factor categories:
- Political: Government policies, regulations, political stability
- Economic: Interest rates, inflation, economic growth, currency exchange
- Social: Demographics, cultural trends, lifestyle changes
- Technological: Innovation, automation, digital transformation
- Environmental: Climate change, sustainability requirements, resource availability
- Legal: Employment law, consumer protection, industry regulations
PESTEL identifies external gaps where organizational strategy doesn’t account for environmental shifts. Late-2025 US rate cuts could lower inventory-financing costs, shrinking cash flow gaps for retail businesses.
Organizations use PESTEL for market entry analysis, long-term strategic planning, and risk assessment. External factor monitoring prevents strategic blindness.
Gap Analysis in Different Business Functions
Organizations apply gap analysis across departments to identify functional inefficiencies and improvement opportunities.
Operations Gap Analysis
Manufacturing operations track production throughput, quality rates, and equipment effectiveness.
Process efficiency metrics reveal bottlenecks in workflows. A factory producing revenue of $180,000 per employee while targeting $250,000 per employee faces a $70,000 productivity gap per worker.
Quality management systems identify defect rates, rework costs, and warranty claims. Lean manufacturing principles guide analysis of waste reduction opportunities across seven categories: transportation, inventory, motion, waiting, overproduction, overprocessing, and defects.
Operational metrics examined:
- Overall Equipment Effectiveness (OEE) percentages
- Cycle time and lead time measurements
- First-pass yield rates
- Capacity utilization levels
Real-time dashboards enable immediate response to performance deviations. Manufacturing analytics software shows how process adjustments affect output without waiting for monthly reports.
Financial Gap Analysis
Revenue targets versus actual performance create planning gaps requiring strategic intervention.
Banking organizations targeting 30% annual growth while achieving 8% growth face a 22 percentage point gap demanding new customer acquisition strategies or product expansion.
Financial performance areas:
- Revenue generation and growth rates
- Cost structure optimization
- Profitability margin analysis
- Cash flow management
- Return on investment metrics
Organizations compare forecast profits to desired profits, revealing gaps between budgeted and actual sales. The planning gap divides into usage gaps (market potential vs. current usage), product gaps (segment positioning), and distribution gaps (market coverage).
Budget variance analysis tracks spending against allocations. Financial departments identify where costs exceed projections and where underspending indicates missed opportunities.
Marketing Gap Analysis
Brand positioning and customer acquisition metrics reveal market penetration shortfalls.
Customer satisfaction scores below 8.5/10 while competitors achieve 9.2/10 indicate experience gaps requiring service improvements or communication enhancements.
Market share analysis compares current position (12%) against targets (18%), highlighting a 6 percentage point gap requiring competitive strategy adjustments.
Digital marketing campaigns track conversion rates, engagement metrics, and customer acquisition costs. Performance gaps between channels guide budget reallocation from underperforming platforms to high-ROI activities.
Technology Gap Analysis
Infrastructure assessments compare current systems against operational requirements and digital maturity goals.
Legacy systems create efficiency barriers. Organizations lacking real-time performance dashboards despite needing instant visibility face technology gaps requiring infrastructure upgrades.
Technology evaluation criteria:
- System integration capabilities
- Scalability and performance
- Security and compliance
- User experience and adoption
- Maintenance and support costs
Healthcare providers face mounting technology pressure. CommerceHealthcare 2024 analysis estimates over $8 billion annually in cost increases from IT inefficiencies, delayed care, data breaches, and fragmented systems.
Cybersecurity gaps pose serious risks. Healthcare experienced the highest total dollar amount of breach losses for the 13th consecutive year compared to all other industries.
Digital transformation initiatives require gap analysis to evaluate readiness. Over half of surveyed organizations use at least 50 software solutions, suggesting fragmented IT environments needing consolidation.
Gap Analysis Benefits and Limitations
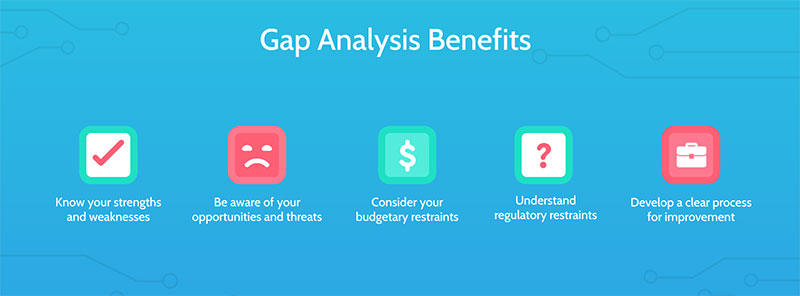
Understanding both advantages and constraints enables realistic expectations and effective implementation.
Strategic Clarity
Gap analysis provides data-driven direction for resource allocation and priority setting.
Organizations gain visibility into blind spots previously hidden by assumptions or incomplete information. Performance gaps become quantifiable rather than speculative, enabling objective decision-making.
Decision-making improvements:
- Clear performance baselines established through measurement
- Objective criteria for initiative prioritization
- Resource allocation aligned with impact potential
- Progress tracking against defined targets
Strategic planning benefits from comprehensive current-state understanding. Teams avoid pursuing initiatives disconnected from actual organizational needs.
Resource Optimization
Targeted investments flow to areas with measurable impact potential rather than scattered across competing priorities.
Budget efficiency improves when funding addresses root causes instead of symptoms. A company wasting resources on new hiring when training existing staff would close skills gaps redirects spending productively.
Prioritization frameworks ensure high-impact, high-urgency gaps receive attention before lower-priority issues. Limited resources concentrate where they generate maximum value.
Performance Enhancement
Systematic improvement becomes possible when gaps are identified, measured, and tracked over time.
Organizations move from reactive problem-solving to proactive performance management. Regular gap assessments create continuous improvement cycles.
Benchmarking against industry standards reveals competitive positioning. Companies achieving 75% first-call resolution while industry average sits at 85% recognize specific improvement targets.
Limitations and Challenges
Gap analysis carries inherent constraints requiring careful navigation.
Data dependency: Analysis quality depends entirely on data accuracy and completeness. Inconsistent measurement methods or incomplete records produce flawed conclusions.
Gathering comprehensive, accurate data proves time-consuming and complex. Organizations need standardized data collection procedures and automated tools to ensure consistency.
Scope creep: Projects expand beyond original boundaries, diluting focus and effectiveness.
Clear objective articulation from the start prevents analysis paralysis. Limited scope and defined boundaries keep initiatives on track.
Resource constraints: Time limitations, insufficient budgets, and poor data quality hinder depth.
Rushed analyses produce shallow, inaccurate findings. External tools streamline processes while expert consultation fills knowledge gaps.
Resistance to change: Team members resist modifications to established procedures and workflows.
Stakeholder involvement early in the process builds buy-in. Training and support facilitate transitions while communicating benefits reduces resistance.
Subjective bias: Personal judgments skew gap identification and recommended actions during data collection and analysis phases.
Multiple perspectives from diverse stakeholders balance individual biases. Cross-functional input provides comprehensive understanding of potential improvement areas.
Implementation challenges: Executing action plans encounters unforeseen obstacles including resistance, insufficient resources, or external market factors.
Monitoring mechanisms track progress and enable course correction. Flexible planning accommodates emerging insights rather than rigid adherence to failing approaches.
Oversimplification risk: Complex problems may be reduced to simplistic terms, underestimating issue depth or solution complexity required.
Root cause analysis drills beyond surface symptoms. Organizations must address fundamental issues rather than quick fixes masking deeper problems.
Common Gap Analysis Mistakes
Avoiding predictable errors improves analysis quality and implementation success rates.
Insufficient Stakeholder Involvement
Organizations conducting gap analysis in isolation miss critical perspectives and face implementation resistance.
Primary and secondary stakeholders provide different viewpoints. Frontline employees understand operational realities executives might overlook.
Cross-functional teams reveal interdependencies between departments. Marketing gaps might stem from product limitations, while sales shortfalls could reflect inadequate lead generation.
Early involvement builds ownership and commitment. People resist changes imposed upon them but support initiatives they helped shape.
Unclear Objective Definition
Vague goals produce unfocused analysis yielding unusable results.
“Improve performance” lacks specificity compared to “increase customer retention rate from 68% to 82% within 12 months.”
SMART goal frameworks force clarity. Measurable targets enable progress tracking while time-bound commitments create urgency.
Scope boundaries prevent analysis sprawl. Examining entire organization simultaneously dilutes focus compared to targeted departmental assessment.
Inadequate Data Collection
Incomplete or inaccurate information undermines entire analysis regardless of framework sophistication.
Data quality issues:
- Inconsistent measurement methods across time periods
- Missing historical records for baseline establishment
- Unvalidated assumptions treated as facts
- Sampling bias in surveys or interviews
Organizations must invest in robust data collection systems before analysis begins. Automated tracking provides continuous measurement versus periodic manual snapshots.
Multiple data sources triangulate findings. Financial reports, customer feedback, employee surveys, and operational metrics together paint complete pictures.
Unrealistic Target Setting
Aspirational goals disconnected from organizational capacity create frustration and abandonment.
Industry benchmarks guide achievable targets. If top performers achieve 95% on-time delivery, aiming for 99.5% without understanding enabling factors sets unrealistic expectations.
Incremental improvement paths work better than massive leaps. Moving from 75% to 80% customer satisfaction provides stepping stone toward eventual 90% target.
Resource availability constrains possibilities. Targets requiring investments beyond budgets or capabilities set teams up for failure.
Poor Root Cause Analysis
Addressing symptoms instead of underlying causes wastes resources on ineffective solutions.
Five-whys methodology drills to fundamental issues. Revenue decline traced through marketing reduction, budget cuts, cash flow problems, and ultimately poor product-market fit requires different intervention than surface symptom suggests.
Fishbone diagrams organize contributing factors systematically. Categories like Methods, Materials, Machines, Manpower, Measurements, and Environment reveal multiple causation points.
Analysis depth requirements:
- Why symptoms manifest (immediate causes)
- What enables those causes (contributing factors)
- How factors interconnect (systemic relationships)
- Where intervention produces maximum leverage
Quick fixes mask problems temporarily while root causes persist. Durable solutions address fundamental issues.
Weak Action Planning
Gap identification without concrete implementation steps produces no results.
Vague recommendations like “improve customer service” fail compared to specific actions: “Implement 24/7 chatbot support (John, March 15, $25K) and train support team on new protocols (Sarah, March 30, $10K).”
Action plan components:
- Specific steps with clear deliverables
- Assigned ownership and accountability
- Defined timelines and milestones
- Allocated budgets and resources
- Success metrics and tracking mechanisms
Resource allocation matches ambition. Underfunded initiatives stall regardless of planning quality.
Lack of Follow-Through
Analysis without implementation monitoring leads to abandoned initiatives and wasted effort.
Regular progress reviews maintain momentum. Weekly check-ins for critical initiatives prevent drift while monthly strategic assessments ensure alignment.
Accountability structures assign responsibility. Named owners track metrics, report status, and escalate roadblocks.
Adjustment processes respond to implementation learnings. Rigid plans failing in practice require modification based on real-world feedback.
Insufficient Monitoring
Organizations losing visibility into gap closure progress can’t assess effectiveness or identify needed corrections.
Tracking requirements:
- Real-time dashboards for critical metrics
- Weekly status reports for active initiatives
- Monthly performance summaries
- Quarterly strategic reviews
Automated alerts notify teams when metrics deviate from targets. Immediate awareness enables faster response than delayed discovery.
Performance management software centralizes tracking across multiple initiatives. Single source of truth prevents confusion from scattered spreadsheets.
Gap Analysis Examples Across Industries
Different sectors face unique challenges requiring tailored gap analysis approaches.
Manufacturing
Production efficiency gaps between current output (700 units) and target output (1,000 units) represent 30% performance shortfall.
Quality defect rates of 3.2% versus industry best practice of 1.5% create warranty cost burdens and customer dissatisfaction.
Equipment downtime averaging 18% while competitors achieve 8% indicates maintenance practice gaps or asset replacement needs.
Lean manufacturing principles guide waste identification across value streams. Gap analysis reveals non-value-adding activities consuming resources without customer benefit.
Healthcare
McKinsey analysis shows hospital systems face 200-basis point gap between reimbursement rates and cost inflation.
Patient financial experience suffers from affordability challenges. 26% of Americans report healthcare costs strain their finances, while 23% have insurance coverage gaps according to Harris poll data.
Clinical workforce shortages create staffing gaps. Physician shortfalls between 13,500 to 86,000 projected by 2036 require recruitment and retention strategies.
Technology gaps hinder efficiency. Only 45% of frontline clinicians trust leadership to do right by patients, indicating communication and trust-building needs.
Financial Services
Banking organizations targeting 30% annual growth while achieving 8% face strategic gaps requiring new customer acquisition or product expansion.
Digital transformation lags customer expectations. Financial institutions lacking mobile-first experiences lose market share to fintech competitors.
Compliance gaps create regulatory risk. Organizations failing to meet evolving requirements face fines and reputational damage.
Customer experience scores below competitor benchmarks indicate service improvement opportunities across digital and physical channels.
Retail
Market share gaps between current position (12%) and targets (18%) require competitive strategy adjustments.
Inventory management inefficiencies create stock-outs (lost sales) and overstock (carrying costs). Gap analysis between optimal and actual inventory levels guides purchasing decisions.
E-commerce capabilities lag pure-play online competitors. Traditional retailers recognizing digital experience gaps invest in omnichannel integration.
Customer retention rates below 70% while industry leaders achieve 85% highlight loyalty program or service quality gaps.
Technology
Product feature gaps emerge when competitor offerings exceed current capabilities. Market analysis reveals which features customers demand but products lack.
Development velocity lags market pace. Software companies releasing updates quarterly while competitors ship weekly face competitive disadvantage.
Talent gaps in emerging skills like AI, machine learning, or cloud architecture limit innovation capabilities.
Technical debt accumulation creates maintenance burdens. Code refactoring needs versus current practices reveal software quality gaps.
Education
Achievement gaps between student performance and grade-level expectations require instructional intervention.
Resource disparities create funding gaps affecting facility quality, technology access, and program offerings.
Teacher skills gaps in new pedagogical approaches or technology integration need professional development investment.
Curriculum alignment gaps between taught content and assessment requirements affect student outcomes.
Government
Service delivery gaps between citizen expectations and actual experiences indicate process improvement needs.
Budget gaps between revenue projections and actual collections require fiscal adjustments or service reductions.
Infrastructure maintenance gaps accumulate when deferred maintenance creates larger future costs.
Digital services lag private sector capabilities. Citizens expecting online convenience find manual, paper-based processes frustrating.
Implementation Challenges and Solutions
Practical obstacles require strategic responses ensuring gap analysis translates into organizational improvement.
Data Availability Issues
Challenge: Organizations lack comprehensive, accurate data for thorough current state assessment.
Historical records may be incomplete, inconsistent, or stored in incompatible systems. Different departments use varying measurement approaches preventing aggregation.
Solutions:
Implement standardized data collection procedures across all departments. Create centralized data repositories with consistent formatting and regular updates.
Invest in automated tracking systems replacing manual processes. Real-time data capture eliminates retrospective reconstruction from memory or partial records.
Start small with available data rather than delaying for perfect information. Incremental data improvements occur through each analysis cycle.
Stakeholder Resistance
Challenge: Team members oppose process changes, workflow modifications, or new accountability requirements.
People comfortable with existing approaches resist disruption. Fear of increased workload or skill inadequacy drives opposition.
Solutions:
Involve stakeholders early in gap identification. People support changes they help design versus mandates imposed upon them.
Communicate benefits clearly linking initiatives to personal interests. Show how improvements reduce frustrations or create advancement opportunities.
Provide adequate training and support during transitions. Skill development reduces anxiety while demonstrated commitment builds confidence.
Celebrate early wins publicly. Success stories reduce skepticism and build momentum for broader adoption.
Resource Limitations
Challenge: Budget constraints, time pressures, or personnel shortages prevent comprehensive analysis or robust implementation.
Organizations want improvement without investment. Competing priorities drain attention from gap closure initiatives.
Solutions:
Prioritize ruthlessly focusing on highest-impact gaps first. Demonstrate ROI from initial successes before expanding scope.
Leverage existing resources creatively. Cross-functional teams pool expertise without new hires while project management software organizes efforts efficiently.
Phase implementations spreading costs over time. Incremental rollouts reduce upfront investment while generating learnings informing later stages.
Seek external funding sources for transformational initiatives. Grants, partnerships, or financing arrangements supplement operating budgets.
Timeline Pressures
Challenge: Urgency demands quick results conflicting with thorough analysis requirements.
Leadership wants immediate improvement. Market conditions create competitive pressure for rapid response.
Solutions:
Balance speed with rigor through focused scope. Analyze critical gaps thoroughly rather than superficially examining everything.
Use rapid assessment techniques for time-sensitive situations. Quick SWOT analyses provide directional guidance pending deeper investigation.
Implement parallel workstreams. Analysis continues while initial actions address obvious gaps requiring no additional research.
Set realistic expectations about timeframes. Sustainable improvements require adequate planning despite urgency temptations.
Measurement Difficulties
Challenge: Some gaps resist quantification making progress tracking ambiguous.
Cultural issues, employee engagement, or innovation capacity lack clear metrics. Qualitative assessments feel subjective.
Solutions:
Develop proxy measures for intangible concepts. Employee engagement surveys, innovation pipeline counts, or culture assessment tools quantify soft factors.
Combine quantitative and qualitative indicators. Numbers provide trending while narratives explain context.
Establish baseline measurements even if imperfect. Consistent methodology enables comparison over time regardless of precision limitations.
Benchmark against comparable organizations. Relative performance matters more than absolute measures for some dimensions.
Change Management
Challenge: Organizational inertia resists transformation despite identified gaps.
Culture, processes, and systems reinforce status quo. Momentum favors continuation over change.
Solutions:
Build compelling change narrative explaining why transformation matters. Connect gap closure to organizational survival or prosperity.
Secure executive sponsorship providing visible leadership commitment. Top-down support legitimizes initiatives while removing political obstacles.
Create change agent networks across organization. Distributed champions drive adoption at local levels more effectively than central mandates.
Address both technical and human dimensions. Process redesigns fail without corresponding skill development, communication, and cultural reinforcement.
Gap Analysis Software and Technology
Performance management software reached $12.15 billion in 2024, growing toward $38.76 billion by 2034 (Fundamental Business Insights).
Organizations adopt specialized tools to streamline gap identification across operations. Business intelligence platforms grew from $36.60 billion in 2023 to a projected $86.69 billion by 2030 (Grand View Research).
Cloud deployments captured 65% of enterprise performance management market share in 2025. This shift reflects broader patterns where 89% of enterprise workloads now run in cloud environments.
Performance Management Platforms
Real-time tracking capabilities:
- Continuous performance monitoring replaces annual reviews
- Automated variance detection flags deviations from targets
- Integration with existing ERP and CRM systems
Dresner Advisory Services found 71% of enterprises now use formal performance management processes, up from 62% in 2023.
58% of companies still rely on basic spreadsheets for tracking (Select Software Reviews). The gap between available technology and actual adoption remains wide.
Cloud-based solutions offer flexibility. 60% of new implementations in 2024 chose cloud deployment over on-premise alternatives (IHRIM).
Business Intelligence Tools
BI software transforms raw data into actionable gap insights.
North America held 37.8% of the global BI market in 2023. The region leads in early adoption of analytics platforms that identify performance discrepancies.
Key capabilities include:
- Automated data aggregation from multiple sources
- Predictive analytics for future gap forecasting
- Custom dashboard creation for stakeholder reporting
Over 70% of large U.S. enterprises with 100+ employees had implemented BI tools by 2023 (U.S. Bureau of Labor Statistics).
MicroStrategy’s subscription sales jumped 61.6% in Q1 2025 while perpetual licenses fell. The market clearly favors recurring-access models over one-time purchases.
Specialized Gap Analysis Software
Purpose-built platforms focus exclusively on gap identification and action planning.
These tools combine current state assessment with target definition. Users map existing capabilities against desired outcomes through structured workflows.
Process automation features:
- Stakeholder survey distribution and collection
- Automated gap quantification and prioritization
- Action plan tracking with milestone alerts
Corporate performance management software grew from $14.63 billion in 2025 toward $52.39 billion by 2034, maintaining a 15.23% CAGR (Business Research Insights).
AI-enabled forecasting tools saw adoption increase by 54% across organizations. Machine learning algorithms now predict where gaps will emerge before they impact operations.
Integration Capabilities
Modern gap analysis platforms connect with existing business systems.
API integration allows data flow between performance tools and operational software. Real-time sync eliminates manual data entry and reduces error rates.
Common integrations include:
- HRIS systems for workforce data
- Financial platforms for budget tracking
- Project management frameworks for execution monitoring
- CRM systems for customer feedback
Microsoft Power Platform surpassed 20 million monthly active users in 2024. Low-code tools democratize gap analysis beyond technical specialists.
The enterprise performance management market reached $7.14 billion in 2024, with projections to $10.81 billion by 2029 (9cv9 Research).
Cloud vs. On-Premise Deployment
Cloud solutions dominate new implementations. Scalability and remote access drive preference over traditional on-premise installations.
But regulated industries maintain hybrid approaches where data residency rules apply.
Cloud platforms reduce infrastructure costs while supporting global team collaboration. Organizations avoid hardware investments and benefit from automatic updates.
On-premise advantages persist:
- Full data control for compliance requirements
- Customization for unique workflows
- No recurring subscription costs
40% of small and medium enterprises cite upfront costs as barriers to performance management system adoption (Small Business Administration 2024).
Mobile and Remote Access
Mobile app integration increased employee engagement in performance tracking by 35% compared to desktop-only platforms (SHRM 2024).
Distributed workforces demand anywhere access to gap analysis data. Mobile-friendly dashboards grew by 53% as a preferred feature in 2024.
Teams review progress and update action items from field locations. Real-time visibility replaces delayed reporting cycles that miss emerging gaps.
AI and Analytics Features
Artificial intelligence transforms gap identification from reactive to predictive.
AI-based analytics adoption in corporate performance management platforms increased by 54% in 2024. Advanced forecasting capabilities enable proactive gap closure before performance suffers.
Machine learning applications:
- Pattern recognition in historical gap data
- Automated root cause identification
- Predictive modeling for future state planning
Natural language processing allows conversational queries. Users ask “What skills gaps exist in our engineering team?” and receive instant analysis.
Domo partnered with Brooklyn Data Co. in September 2024 to enhance data management for joint users. Collaboration features accelerate insight generation.
Industry-Specific Solutions
Healthcare and BFSI sectors together accounted for 44% of analytics software deployments. Vertical-specific tools address unique regulatory and operational requirements.
Manufacturing platforms integrate IoT sensor data with production metrics. Retailers connect point-of-sale systems to inventory management for market gap identification.
Financial services firms use BI to manage risk and ensure regulatory compliance. The healthcare sector recorded a 22% increase in analytics spending in 2023 driven by demand for predictive patient outcomes.
Implementation Costs and ROI
Software integration challenges affect 30% of companies during deployment (NIST 2024). System compatibility problems create delays that extend time-to-value.
Performance improvement strategies using gap analysis software led to a 20% increase in talent engagement and retention across organizational levels.
Companies with structured performance management practices become 4.2 times more likely to outperform competitors (McKinsey 2023).
Cost considerations include:
- Platform licensing or subscription fees
- Implementation and integration services
- User training and change management
- Ongoing maintenance and support
Large enterprises demonstrate higher success implementing full BI programs combined with predictive analytics and AI capabilities. Their scale justifies comprehensive technology investments.
Selection Criteria
Organizations evaluate platforms across multiple dimensions before purchase.
Primary evaluation factors:
- Ease of use for non-technical users
- Integration with existing technology stack
- Scalability to support growth
- Vendor support and training resources
- Security and compliance certifications
Cloud security concerns slow adoption for some organizations. Data breach risks and compliance requirements demand robust security measures.
Employee performance management software will continue shifting toward AI-powered continuous feedback systems. Traditional annual reviews give way to real-time gap identification and correction.
FAQ on Gap Analysis
What is gap analysis used for?
Gap analysis identifies discrepancies between current performance and desired outcomes. Organizations use it for strategic planning, performance improvement, skills assessment, and market opportunity identification.
It transforms abstract goals into measurable targets with actionable steps.
How long does a gap analysis take?
Timeline varies by scope and complexity. Simple performance gap analysis takes 2-4 weeks. Comprehensive strategic gap analysis spanning multiple departments requires 8-12 weeks.
Data collection quality directly impacts duration.
Who should conduct a gap analysis?
Cross-functional teams produce the best results. Include department heads, primary and secondary stakeholders, subject matter experts, and analysts.
External consultants bring objectivity but internal teams understand organizational nuances better.
What’s the difference between gap analysis and SWOT analysis?
Gap analysis measures specific performance differences between current and future states. SWOT analysis evaluates strengths, weaknesses, opportunities, and threats broadly.
Gap analysis is measurement-focused while SWOT provides strategic context.
Can small businesses benefit from gap analysis?
Absolutely. Small businesses use skills gap analysis for hiring decisions and market gap analysis to identify underserved customer segments.
The framework scales down effectively without expensive software or consultants.
What tools are needed for gap analysis?
Basic gap analysis requires spreadsheets for data tracking. Advanced implementations use performance management software, business intelligence platforms, or specialized gap analysis tools.
Many organizations start simple then adopt technology as needs grow.
How often should organizations conduct gap analysis?
Annual strategic gap analysis aligns with planning cycles. Performance gap analysis happens quarterly or monthly. Skills gap analysis runs during workforce planning or before major hiring initiatives.
Frequency depends on rate of change in your industry.
What are common gap analysis mistakes?
Setting unrealistic targets creates frustration. Insufficient stakeholder involvement produces incomplete data. Poor root cause analysis leads to surface-level solutions.
Lack of follow-through undermines the entire process regardless of analysis quality.
How does gap analysis relate to continuous improvement?
Gap analysis identifies improvement opportunities while continuous improvement methodologies execute solutions. The two work together in performance optimization cycles.
Agile methodology teams incorporate gap analysis into sprint retrospectives.
What industries use gap analysis most?
Manufacturing applies it to operational efficiency and quality metrics. Healthcare uses it for patient care standards and compliance requirements. Technology companies focus on skills gaps and product-market fit.
Financial services apply gap analysis to risk management and regulatory compliance.
Conclusion
Understanding what is a gap analysis gives organizations a structured approach to bridge the distance between current state and future objectives. The methodology works across functions from workforce competency assessment to market opportunity identification.
Success depends on honest current state evaluation and realistic target setting. Without accurate data collection and stakeholder buy-in, even the best frameworks fail.
Performance measurement tools accelerate the process but aren’t mandatory. Small teams conduct effective gap analysis using spreadsheets and clear documentation.
The real value emerges in execution. Analysis identifies gaps while action plans close them.
Organizations that integrate gap analysis into regular planning cycles spot emerging problems early. They allocate resources more effectively and track progress against benchmarks systematically.
Start small, measure often, adjust quickly.
- What Is a War Room and How to Use it in Project Management - January 23, 2026
- What Is Application Lifecycle Management? ALM Explained - August 20, 2025
- How To Create a Process For Your Development Team to Follow - August 18, 2025


