

The experience starts before the first tap. ISO 9241-210 (2019) defines user experience as a person’s perceptions and responses that result from the use and/or anticipated use of a product, which means expectations count as much as the screen itself.
That is why polished interface work alone can’t repair a product people struggle to use. UI/UX design pairs the look and interactive behavior of a screen (user interface) with research into how people move through the whole product (user experience), so tasks get finished with little effort. Software companies and agencies apply it, and so do online stores, to websites and mobile apps as well as internal tools. Teams judge the result with measures like task success rate and System Usability Scale scores.
What is UI/UX design?
The slash in the name covers two jobs. One handles the visual and interactive layer of a product. The other is research-based design of the whole experience around that layer. Both aim at the same outcome, which is people finishing tasks easily, accessibly and with some enjoyment.
Put plainly, it’s a product people can use without struggling.
UI design

UI design covers whatever a person sees and touches on a screen.
- Layout and spacing
- Color palette and typography
- Buttons, icons and form fields
- How each element reacts to a tap, hover or click
Its working documents are the style guide and the mockup. The test is whether a screen stays clear, consistent and readable at every device size.
UX design

ISO 9241-210 (2019) frames user experience as the perceptions and responses a person has before, during and after using a product, system or service. Emotions, preferences, behaviors and accomplishments all count. A task succeeding is only part of it.
Don Norman and Jakob Nielsen went for similar breadth in their 1998 Nielsen Norman Group definition, which covers every aspect of someone’s interaction with a company, its services and its products.
So UX design runs on user research and usability testing, with the user journey mapped in between.
NN/g’s own example is a movie review site. Even a perfect search interface delivers a poor experience to someone hunting for a small independent release if the database only covers major studios.
How UI design differs from UX design

UX design decides what a product does and how people move through it, and UI design decides how it looks and responds on screen.
Jesse James Garrett’s Elements of User Experience maps the split well. His 2000 diagram, expanded into a 2002 book, stacks five planes from abstract strategy at the base to concrete surface at the top: strategy, scope, structure, skeleton and surface.
UI design works mostly on the surface plane, plus the skeleton plane where interface elements get placed. UX design runs through all five.
| Aspect | UI design | UX design |
|---|---|---|
| Focus | Look, layout and interactive behavior of screens | The whole journey and the task flow |
| Typical deliverables | Style guide, mockups, interactive prototypes | Personas, user journeys, wireframes, test reports |
| Core methods | Visual design, interaction design | User research, usability testing, information architecture |
| Success looks like | Clear, consistent, readable screens | Users finish tasks and rate the experience well |
| Applies to | Digital screens and interfaces only | Digital and physical products, services |
Explainers disagree on whether UI belongs inside UX or sits next to it. Honestly, both views hold up, depending on what you’re measuring.
As a scope, UI sits inside UX. It’s the layer people touch.
As a job, they’re often two roles with different methods and different deliverables.
Neither half finishes before the other starts. A test result on the surface can force a rethink of scope, so treating UI as paint applied after UX is done tends to backfire.
What disciplines make up UI/UX design?
The work splits into visual design and interaction design on the UI side, and information architecture, user research and usability on the UX side.
UI side
Visual design handles color, typography, spacing, iconography and color contrast.
Interaction design is about how elements respond. That includes states, transitions and the feedback a person gets after a tap.
UX side
Information architecture decides how content and features are grouped, named and ordered. User research (interviews, surveys, observation) feeds the personas and journey maps. Usability is how easy a product is to learn, how efficient it is, and how pleasant it feels to use.
Garrett’s structure plane is the closest match for information architecture. It decides what the product categories are, while the skeleton decides how the navigation for them is laid out.
Where usability fits
ISO 9241-210 adds that usability criteria can be used to assess aspects of user experience. NN/g places usability one level lower, as a quality attribute of the interface covering how easy a system is to learn, how efficient it is and how pleasant it feels.
Read together, usability is the bridge. It gets measured on the interface and reported as evidence about the experience.
Where navigation and responsive design overlap
Two topics refuse to belong to one half. UX decides what goes in the menu and which tasks matter on a phone, while UI decides how the menu looks and how layouts reflow.
How the UI/UX design process works
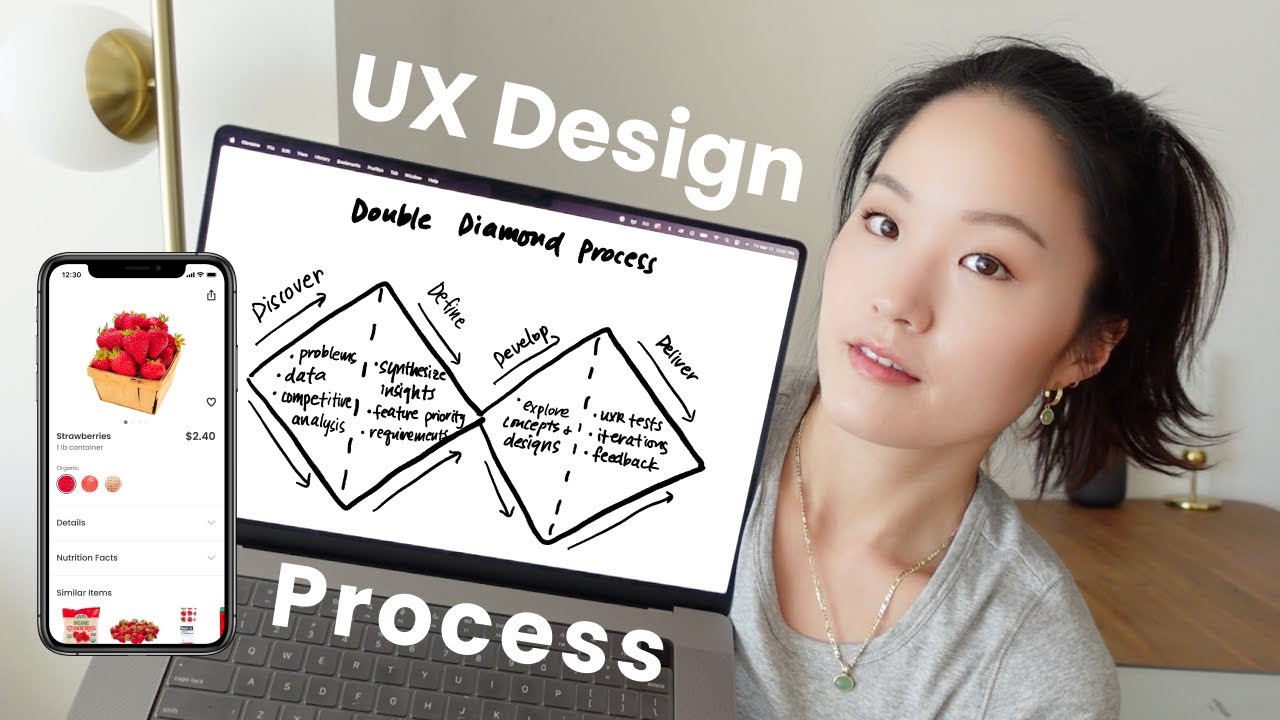
Findings from late stages send teams back to earlier ones, so the process behaves like a loop more than a line. Most teams still walk through it in a familiar order.
The stages in order
- Research: interviews, surveys and analytics review to learn who the users are and what blocks them
- Define: findings become a problem statement and a list of requirements
- Ideate: sketches, sitemaps and user flows, then low-fidelity wireframes
- Design: mockups and a clickable prototype that follow the style guide
- Test: real users attempt real tasks on the prototype while the team records task success
- Iterate: fixes go back into the design, then specs and assets go to developers
The prototype in step four is a working model of the product built before development starts, so layout and flow problems surface before anyone writes production code.
Where the Double Diamond fits
The Design Council’s Double Diamond describes any design project in four phases: Discover, Define, Develop and Deliver. Its own framework page says the model launched in 2004, though many secondary articles repeat 2005.
- Discover is the research stage, where the team understands the problem instead of assuming it.
- Define maps to the define stage and ends in a clear problem statement.
- Develop covers ideate and design, exploring different answers to that problem.
- Deliver takes in test, iterate and hand off, with solutions tried out repeatedly.
Count the stages however you like. Five, six and seven step versions describe the same loop.
What breaks the process
Skipping research and define means the team assumes the problem, which is exactly what the Design Council’s first diamond exists to prevent.
Handoff is the other weak spot. Bring in the front-end developers who will build the interface before the specs are final, not on the day they arrive.
ISO 9241-210 (2019) puts the loop in writing. Iteration and user-centred evaluation are two of its six principles for human-centred design.
UI/UX design deliverables, from persona to design system
A project moves from research to build through persona, user flow, wireframe, mockup, prototype and design system.
Each one answers a different question and belongs to a different stage of the process above.
Persona and user flow
A persona is a profile of one target user type, built from interviews, with goals, motivations and the tasks that user needs to finish.
A user flow traces the path that persona takes through the product to complete one task. A journey map stretches that path across phases and adds what the person does, thinks and feels along the way.
Skip personas and the team designs for itself. Skip flows and navigation gets decided screen by screen.
Wireframe, mockup and prototype

A wireframe is a greyscale layout with placeholder text and images, built to settle structure. A mockup is a static screen with real colors, typography and imagery. The prototype is a clickable model that behaves like the product, so users can test it.
UXPin’s 2026 guide calls the old claim that low fidelity is quick and high fidelity is slow increasingly outdated.
It still recommends low-fidelity prototypes for early work, when a team needs to explore several concepts fast. That’s the case for laying out screens as wireframes first, before color and type enter the conversation.
Design system
A design system outlives the project.
It’s a library of reusable components governed by shared standards and principles, usually split into foundations (color, typography, spacing, accessibility rules) and components (buttons, forms, navigation).
- Style guide
- Component library
- Pattern library and icon set
Google’s Material Design is a good public example of the structure, and so is the interface guidelines Apple publishes for its platforms.
Which tools do UI/UX designers use?

Figma, Sketch and Axure RP handle interface design and prototypes. Miro takes journey maps and workshops, and Maze and Hotjar cover testing and behavior data.
Design and prototyping tools
| Tool | Runs on | Strongest at |
|---|---|---|
| Figma | Browser, shared files | Real-time co-editing, no-code prototypes, Dev Mode for developers |
| Sketch | macOS 15 or newer only | Vector editing, offline work, free developer handoff |
| Axure RP 11 | PC and Mac | Conditions, variables, data-driven prototypes |
Platform notes come from each vendor’s own site as of October 2026.
Default to Figma. Switch to Axure RP when a test needs conditional logic, like a form that validates input or a grid users can sort and filter.
Sketch is the narrow pick. It suits Mac-only teams and fits mixed teams poorly, since the current app requires macOS Sequoia (15.0.0) or newer.
Longer roundups of tools for building clickable prototypes exist, but these three cover most projects, and each gives developers an inspect view.
Research, testing and workshop tools
- Miro is an online whiteboard for journey maps, workshops and quick wireframes.
- Maze runs prototype testing, surveys, card sorting and tree testing, and it integrates with Figma.
- Hotjar gives you heatmaps, session replays and surveys on live products.
For low-fidelity layouts alone, dedicated apps built for wireframing can be enough. Miro covers quick wireframes when the team already works on its boards.
Hotjar is now part of Contentsquare
Contentsquare’s Hotjar page says new users can no longer create a Hotjar account and should sign up for Contentsquare Free instead.
As of October 2026, the Hotjar free plan was capped at 35 sessions a day, while Contentsquare Free captures 200,000 sessions a month.
Several 2024 tool roundups still list Hotjar as a standalone product, so check the vendor page before budgeting.
Which usability principles and standards apply?
Nielsen’s 10 usability heuristics, WCAG 2.2 and ISO 9241-210 carry most of the weight. What separates them is how strictly each can be checked, and that decides how a team uses it.
| Source | What it is | How it is checked |
|---|---|---|
| Nielsen’s 10 heuristics | Broad rules of thumb | Expert review of the interface |
| WCAG 2.2 | Testable accessibility criteria at levels A, AA and AAA | Pass or fail, criterion by criterion |
| ISO 9241-210 | Process standard for human-centred design | Review of how design activities are planned and run |
Nielsen’s 10 usability heuristics

Jakob Nielsen derived the final ten in 1994 from a factor analysis of 249 usability problems, according to NN/g.
NN/g calls them broad rules of thumb, not specific guidelines. It refreshed the wording in 2020, last reviewed the page on 30 January 2024, and says the ten themselves have not changed since 1994.
NN/g lists them as ten separate items, but they cluster fairly naturally. Visibility of system status, user control and freedom, error prevention, and helping users recognize, diagnose and recover from errors all deal with feedback and control. Match between the system and the real world, consistency and standards, and recognition rather than recall are about fitting what people already know. Flexibility and efficiency of use, aesthetic and minimalist design, and help and documentation round out the list.
Platform owners layer their own rules on top, such as the principles behind Google’s Material Design.
WCAG 2.2
WCAG 2.2 became a W3C Recommendation on 5 October 2023. It adds nine success criteria to WCAG 2.1 (two at level A, four at AA, three at AAA) and removes 4.1.1 Parsing.
- Text contrast of at least 4.5:1, or 3:1 for large text (18 point, or 14 point bold), at level AA
- Pointer targets of at least 24 by 24 CSS pixels, unless spacing or another exception applies (new in 2.2, level AA)
- Keyboard focus never entirely hidden by author content such as a sticky footer (new in 2.2, level AA)
- No cognitive function test, such as remembering a password, at login unless an alternative or assist is offered (new in 2.2, level AA)
Contrast and target size are the two a UI designer can fail in a mockup before any code exists.
ISO 9241-210
ISO 9241-210 (2019) is a process standard for the people who manage design, with requirements and recommendations that run across the life cycle of interactive systems.
Four of its six principles describe who and what a design is built from. Those are an explicit understanding of users, tasks and environments, users involved throughout design and development, a design that addresses the whole user experience, and a team with multidisciplinary skills.
It sets requirements for the process, not the look of a screen, and it leaves detailed methods to other standards.
Fitts’s law and Hick’s law
Two older laws from psychology still show up in interface critique.
Fitts’s law says pointing time depends on target distance and size (Paul Fitts, 1954), so larger, closer targets are quicker to hit.
Hick’s law (William Hick, 1952; Ray Hyman, 1953) holds that more or more complex choices lengthen decision time. The UK Department for Education’s accessibility guidance applies it to forms by splitting long ones into smaller sections. Celerity argues that Hick’s experiments measured response time to a known target, so reading the law as a decision-making rule stretches it.
How is UI/UX design quality measured?
Teams look at behavior (task success rate), attitude (System Usability Scale scores) and business outcomes (conversion rate). None of them is enough on its own.
Task success rate
Five of ten participants finishing a task is a 50% success rate.
NN/g defines the metric as the percentage of users who complete a task in a study, so the real work is deciding what counts as completion before the first session.
Most teams sort outcomes into success, partial success and failure. Success means the task was completed as intended. Partial success means it was completed with errors or a workaround, and failure means it was abandoned or not completed.
Partial successes deserve their own look, because they show where a flow breaks.
System Usability Scale

The System Usability Scale (SUS) is a ten-statement questionnaire that turns perceived usability into a single score.
John Brooke created it in 1986 for use right after a usability test.
A score of 70 sounds like a pass but sits only slightly above average, because the number is a position on a benchmark scale and not a percentage.
The numbers worth knowing:
- The questionnaire has 10 items, each answered on a five-point agreement scale (Brooke, 1986).
- Scores run from 0 to 100 and are read as a benchmark position (Sauro, 2011).
- The average is 68 across nearly 500 studies and more than 5,000 users (Sauro, 2011).
- Items 4 and 10 were once reported as a learnability subscale, with the other 8 as usability (Sauro, 2011). Later analysis found the split mostly reflects item wording, and MeasuringU now advises treating SUS as one measure of perceived usability.
Conversion rate and A/B testing
Conversion rate is the share of visitors who complete a target action, such as a purchase or a sign-up.
Funnel analysis shows where visitors drop off at each step of a flow, and experimentation tools compare two versions of a screen on live traffic.
Treat conversion as the confirming metric. It tells you a redesign moved the business number, and usability testing tells you what moved it.
When UI/UX design stops delivering results
In practice it breaks down when expert review misses real problems, when standards compliance gets mistaken for usability, and when a single metric hides the cause.
Expert review misses problems that users hit
In MeasuringU’s 2012 comparison, four evaluators found 16 of the 50 issues that 50 test users hit, a 32% overlap, and only 9% of their findings never showed up in testing.
Across five studies, heuristic evaluation matched an average of 36% of usability-test problems (range 30% to 43%), with false alarms averaging 34%.
Issues that evaluators flag but a test never shows are better read as long-tail problems than false positives. When 50 users never hit an issue, between 0% and 6% of all users still could, at 95% confidence.
Run the expert review first, then usability testing before trusting either.
A passing score is not a usability result
W3C treats its contrast ratios as thresholds, and its own guidance admits that text can pass nominally while looking much lower in contrast in practice.
ISO 9241-210 has a similar boundary. It gives an overview of human-centred design activities without detailed coverage of methods and techniques, and it does not address all aspects of project management.
Meeting a standard shows a floor was met. It says nothing about whether people finish their tasks.
Numbers hide causes
Task success rate shows how many users finished, not how or why, according to LogRocket’s overview of usability metrics.
SUS gives one composite number. Brooke cautioned that single item scores are not meaningful alone, and findability is not among the ten items (MeasuringU).
Heatmaps and session recordings show what people did but not what they were thinking, a point Typeform’s research tool comparison makes too.
Pair one behavior metric with one attitude metric, then add a method that explains why.
To strengthen your design process, you might also want to discover product feedback software, tools that help gather real user insights and ensure your UX decisions are grounded in actual user experience. These platforms enable designers to refine their work based on feedback.
UI/UX Design FAQ
Can one person handle both UI and UX design?
Yes, some designers cover both. The methods still differ, since UX work runs on research and usability testing while UI work runs on visual and interaction craft, so each needs real time.
Is UI/UX design the same as graphic design?
No, though some explainers file UX under graphic design. NN/g’s definition treats graphical design as one input among several, next to engineering, marketing, industrial design and interface design.
Graphic design brings the visual skill, and UI/UX design adds behavior, task flow and testing.
How does a UI/UX designer differ from a product designer?
Mostly scope. UX design typically owns a journey, while product design typically owns the whole product and its business outcome, according to Awesomic (2026).
Job titles blur that line, so read the job description instead of the title.
Is design thinking the same as the UX design process?
No. Design thinking, popularized by IDEO and Stanford’s d.school, is a general problem-solving approach.
The UX design process narrows it to a digital product, with research and usability testing at its core.
Why does UI/UX design matter for business results?
Usable products cost people less effort. ISO 9241-210 (2019) lists improved productivity, better well-being, less stress, wider accessibility and lower risk of harm among the benefits of usable systems.
In online retail, research on e-commerce sites links interface quality to conversion rates.
Which skills does a UI/UX designer need?

User research, usability testing, information architecture, visual and interaction design, and fluency in a tool such as Figma or Sketch.
Communication counts too, since designers present concepts to developers, clients and teammates, as Caltech CTME’s program guide notes.
Starting UI/UX Design on a Live Product
A team adding UI/UX design to a live product should start with a qualitative usability test, not a visual redesign. Five test users reveal where the product’s most valuable task breaks before any screen changes.
The order that works best:
- Choose the task that carries the most business value.
- Test five users, then fix what breaks.
- Record a System Usability Scale baseline with 40 users.
The cheap round goes first because five participants uncover nearly as many problems as larger groups, according to NN/g (2012). The metric round waits until the obvious faults are gone.
Five users can’t produce a stable score, though. NN/g’s current guidance is 40 participants for most quantitative studies (its 2012 article gave 20 as a minimum), so a System Usability Scale or task success baseline needs its own larger round.
The trade-off is visible progress. Stakeholders read test findings for weeks before they see a new screen.
To see how leading agencies approach user-centered design, this list of the best UI/UX design companies in the USA can provide useful insight.

- Protecting Users and Brand Standards Across Image-Driven Platforms - November 10, 2026
- Go Cheat Sheet - November 9, 2026
- Build or White-Label Software? How Software Teams Decide What to Resell in 2026 - November 9, 2026


