Every JavaScript developer has stared at a blank console wondering why perfectly logical code refuses to work.
Debugging JavaScript is one of those skills that separates developers who ship reliable software from those who spend half their week chasing runtime errors and silent failures.
Studies show developers spend up to 60% of their time fixing bugs. That number drops significantly with the right tools and approach.
This guide covers everything from reading JavaScript error types and using Chrome DevTools breakpoints, to tracing async code failures and debugging minified production builds with source maps.
By the end, you’ll have a clear, practical system for finding and fixing bugs faster.
What is JavaScript Debugging

JavaScript debugging is the process of finding and removing errors in JavaScript code that prevent it from running correctly or producing the expected output. It covers identifying where the problem lives, understanding why it happens, and applying a fix that actually holds up.
What it doesn’t include: performance optimization, code cleanup, or refactoring for readability. Those are separate tasks. Debugging is strictly about broken behavior.
JavaScript makes this harder than most languages. Asynchronous execution, multiple runtime environments (browsers, Node.js, edge runtimes), and a loosely typed system all create failure scenarios that don’t show up cleanly or consistently.
According to studies cited by ECOOP’s DEBT workshop series, developers spend up to 60% of their programming time debugging. For JavaScript developers specifically, that number is significant given how much of modern software development runs on JavaScript across client and server environments.
There’s also the cost side. Coralogix puts the figure at roughly 1,500 hours per year spent on debugging per developer. Fixing a production bug costs up to 100 times more than catching the same issue during the design phase, according to IBM research.
Debugging sits inside a broader software development process that includes writing, testing, and deploying code. But for JavaScript, it tends to demand more attention than developers initially plan for.
Types of JavaScript Errors

Before you can fix a bug, you need to know what kind of error you’re dealing with. The category shapes which tools and approaches actually apply.
Syntax Errors
These are caught immediately. The JavaScript engine can’t parse the code at all, so nothing runs.
- Missing closing brackets, parentheses, or braces
- Typos in reserved keywords
- Invalid escape sequences in strings
Key point: Modern linting in programming tools like ESLint catch most syntax errors before the code ever runs. If you’re not running a linter, you’re debugging things that tooling would have flagged automatically.
Runtime Errors
The code parses fine. It fails during execution. These are trickier because they often depend on specific conditions, user input, or data states that don’t appear in every run.
| Error Type | What Triggers It | Common Scenario |
|---|---|---|
| ReferenceError | Accessing a variable that doesn’t exist | Typo in variable name, wrong scope |
| TypeError | Wrong data type used in an operation | Calling .map() on undefined |
| RangeError | Value outside an allowed range | Infinite recursion, invalid array length |
| SyntaxError (runtime) | Invalid code passed to eval() | Dynamically evaluated strings |
Logic Errors
The worst kind. No error message, no exception. The code runs perfectly and returns the wrong result.
Logic errors require you to actually understand what the code is supposed to do versus what it does. Off-by-one mistakes in array loops, incorrect conditional logic, and wrong operator precedence (using = instead of ===) are the usual suspects.
These are also the errors that unit testing catches most effectively, which is part of why skipping tests costs teams so much later.
Silent Failures
JavaScript has a habit of failing without telling you. A failed promise with no .catch(), a NaN that propagates through calculations, or an API response that returns null instead of an array.
These don’t throw. They just produce wrong output silently, sometimes for weeks before anyone notices.
JavaScript Debugging Tools
The right tool depends on where the code runs and what kind of error you’re tracking. Browser-based bugs, server-side Node.js issues, and production failures each need a different approach.
Browser DevTools
Chrome DevTools is where most JavaScript debugging starts. It’s bundled directly into Chrome, which holds roughly 65% of global browser market share (StatCounter, 2024), so it’s the environment most users actually run your code in.
Core features for debugging:
- Sources panel for setting breakpoints and stepping through code
- Console for live evaluation and error output
- Network tab for tracing failed API calls and async request timing
- Call stack panel for seeing exactly how execution reached a failure point
- Watch expressions for monitoring specific variables in real time
Firefox Developer Tools offers strong alternatives, particularly for CSS grid inspection and privacy-focused debugging. Both are free and built into the browser.
In 2024, Chrome DevTools added an AI Assistant panel (backed by Gemini) that can suggest style fixes and summarize error context. Early impressions are mixed but it’s genuinely useful for obvious DOM-related issues.
Node.js Debugging Tools
Server-side JavaScript doesn’t run in a browser, so DevTools alone won’t cut it. Node.js has its own debugging surface.
The built-in Node.js inspector connects directly to Chrome DevTools via the --inspect flag, which most developers don’t realize is an option until they’ve spent too long using console.log everywhere.
- VS Code debugger integrates with Node through
launch.jsonconfigs - ndb (by Google) wraps the Node debugger with a cleaner interface
- The built-in
node --inspect-brkpauses execution at the first line, giving you time to attach a debugger
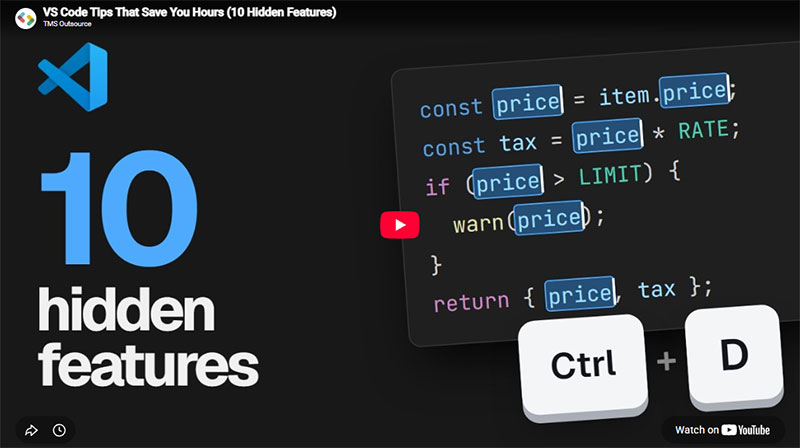
The VS Code debugger is what most teams actually use. It handles breakpoints, variable inspection, and call stack viewing without leaving the editor.
External and Production Tools
Local debuggers don’t help when the bug only appears in production. That’s where monitoring tools become the real debugging environment.
Sentry captures runtime exceptions with full stack traces, user context, and breadcrumb trails showing what happened before the error. LogRocket records session replays so you can watch exactly what a user did before something broke. Datadog handles distributed tracing across microservices where a single user action triggers code across multiple services.
Businesses lost an estimated $3.1 trillion due to poor software quality in 2024 (Aspiresys). Production monitoring isn’t optional at scale.
How to Use Breakpoints in JavaScript

Breakpoints are the core debugging technique. They pause code execution at a specific line so you can inspect the program’s state exactly at that moment.
Most developers default to console.log out of habit. Breakpoints are almost always faster. You get the full variable scope, the call stack, and the ability to step through logic one line at a time, without modifying the source code.
Types of Breakpoints in Chrome DevTools
| Breakpoint Type | How to Set It | Best For |
|---|---|---|
| Line-of-code | Click line number in Sources panel | Most debugging scenarios |
| Conditional | Right-click line number, add expression | Loops, only triggers on specific values |
| Logpoint | Right-click line, select “Add logpoint” | Logging without modifying source |
| DOM change | Right-click DOM node in Elements panel | Tracking unexpected DOM mutations |
The debugger Statement
Drop debugger; directly into your JavaScript source and the browser will pause there automatically when DevTools is open. Useful when you can’t easily navigate to the right file in the Sources panel.
Remove it before committing. A debugger statement left in production code will freeze execution in any browser where DevTools happens to be open. I’ve seen this shipped to production more than once.
Stepping Through Code
Once paused, you control execution manually:
- Step Over (F10) runs the current line and moves to the next, without entering functions
- Step Into (F11) enters the function call on the current line
- Step Out (Shift+F11) finishes the current function and returns to the caller
Watch expressions let you pin specific variables and see their values update in real time as you step through. Much faster than guessing what a variable holds at any given point in the call stack.
Debugging Asynchronous JavaScript

Async debugging is where most developers get stuck. The problem isn’t the code itself but the execution model.
In synchronous code, the call stack tells you exactly how you got somewhere. In async code, the original calling context is gone by the time a callback or promise resolves. The stack trace often starts at the runtime internals rather than your code.
Why Async Code Is Harder to Debug
A RisingStack survey found that 18% of Node.js developers identify debugging as their single greatest challenge, with async programming and error handling cited as specific pain points by 6 to 8% of respondents.
The three async patterns each have different failure modes:
- Callbacks: Error-first convention is easy to skip; silent failures when the error parameter goes unhandled
- Promises: Unhandled rejections used to fail silently; now throw warnings but still cause confusion in long chains
- async/await: Cleaner syntax, but forgetting
awaitreturns a pending Promise instead of the resolved value, and the bug looks nothing like what actually went wrong
Async Stack Traces in Chrome DevTools
Chrome DevTools has an “Async” option in the Call Stack panel that reconstructs the full execution chain across async boundaries. Enable it in DevTools Settings under Experiments.
With async stack traces on, you can see the original line that triggered an async operation even after it resolves. Without it, you get a trace that starts mid-execution with no useful context.
Pause on caught exceptions is another setting worth enabling. It stops execution the moment any exception is thrown, even if your code has a try/catch wrapping it. Useful for catching errors that get swallowed before you ever see them.
Common Async Bugs
Race conditions are the hardest. Two async operations running in parallel, each depending on the other’s output, resolving in an order you didn’t expect. These almost never reproduce consistently in development and tend to appear under production load conditions.
Unhandled promise rejections are more common but easier to catch. Node.js 15+ converts them to fatal errors by default. Older codebases that predate that behavior may have a lot of silently failing promises worth auditing.
Console Methods for JavaScript Debugging

console.log is fine. It’s also the least useful console method most of the time. The full console API has tools that make debugging significantly faster when used correctly.
Beyond console.log
console.table is the one most developers discover late and immediately wonder how they lived without it. Pass any array of objects and it renders as a sortable table in the DevTools console. Extremely useful for debugging API responses and transformed data arrays.
The full set worth knowing:
- console.warn / console.error output colored warnings and errors, with stack traces on
.error() - console.group / console.groupCollapsed group related log output into collapsible sections
- console.time / console.timeEnd measure how long a block of code actually takes
- console.trace prints the full call stack at the point it’s called, no breakpoint needed
- console.count tracks how many times a line is hit, useful for catching unexpected loops
Practical Patterns
Label your logs. console.log('userData:', userData) is infinitely more useful than console.log(userData) when you have ten logs firing simultaneously.
The JetBrains 2023 Developer Ecosystem Survey found that 32% of JavaScript developers don’t write unit tests. For that group especially, console-based debugging tends to be the primary method for tracking down logic errors. That works, but only if you’re using the full console API rather than just .log() everywhere.
One pattern that helps: use console.groupCollapsed('fetchUser response') around API response logging. The output stays collapsed in the console until you need it, so you don’t drown in noise during normal development.
Debugging JavaScript in Production

Production debugging is a different problem entirely. You can’t open DevTools on a user’s machine. The code is minified. Stack traces point to line 1, column 9281 of main.min.js. Good luck with that.
VentureBeat data puts the cost of fixing bugs at around 20% of developer time, and IBM research shows production bugs cost up to 100 times more to fix than issues caught during design. The earlier you catch it, the cheaper it is.
Source Maps
What they do: Source maps are JSON files that link minified production code back to the original source. When a runtime error occurs in bundle.min.js, the map file translates the error location to the exact line in your original .ts or .jsx file.
Without them, you’re reading errors like TypeError at main.8a3b2.js:1:2345. With them, you see the actual function name and line number.
Three hosting strategies worth knowing:
- Public source maps alongside JS bundles: easy to debug, but source code is exposed
- Hidden source maps (via
devtool: 'hidden-source-map'in Webpack): no public reference in the JS file, maps stay private - Upload to error trackers only (Sentry, Rollbar): best security, maps never hit the browser
Source maps don’t affect load times for regular users. They’re only downloaded when DevTools is open, so shipping them to production has no performance cost.
Error Monitoring Tools
Sentry is the one most teams end up with, and for good reason. It captures runtime exceptions with full stack traces (translated via source maps), user context, breadcrumbs showing the last 10 actions before the error, and release tracking so you know exactly which deploy introduced a bug.
LogRocket goes a step further with session replay, recording the exact sequence of user interactions before a crash.
Datadog handles distributed tracing, which matters when a single user action triggers JavaScript that calls multiple backend services, and you need to trace the failure across the whole chain.
Poor software quality cost businesses an estimated $3.1 trillion in 2024, according to Aspiresys. For teams building at scale, production monitoring isn’t a nice-to-have, it’s the difference between catching bugs in minutes versus discovering them when users start filing support tickets.
Reproducing Production Bugs Locally
The hardest part of production debugging is that many bugs only appear under specific conditions: a particular browser, a user’s account state, a race condition under load.
Two techniques that actually help:
- Use git bisect to identify the exact commit that introduced a regression
- Pull the production build locally with source maps enabled and replay the error sequence from session logs
One thing to watch: never log sensitive user data to production error trackers. Sentry and LogRocket both have PII scrubbing features. Use them.
Common JavaScript Bugs and How to Fix Them

Some bugs appear constantly across every JavaScript project regardless of framework, team size, or coding style. Knowing what they look like saves real time.
TypeError: Cannot Read Properties of Undefined
The most common JavaScript runtime error, full stop.
Root cause: Accessing a property on a value that’s undefined or null. Usually happens when an API response doesn’t match the expected shape, or when component state hasn’t been initialized before the first render.
Fix it with optional chaining:
// Before (throws if user is undefined) console.log(user.address.city);
// After (returns undefined safely) console.log(user?.address?.city); `
In React specifically, this error often shows up during the first render before async data arrives. Initialize state with a safe default (null, [], or {} depending on the expected shape) to avoid the crash.
Scope Issues: var in Loops
Classic JavaScript footgun. Using var inside a for loop doesn’t create block scope, so the variable leaks out and retains its last value when closures capture it.
Every JavaScript developer hits this eventually (it took me an embarrassingly long time to fully internalize it). The fix is always the same: replace var with let or const.
- var: function-scoped, hoisted to the top of the enclosing function
- let: block-scoped, the correct choice for loop counters
- const: block-scoped, can’t be reassigned (use for everything else)
this Binding in Callbacks
Rollbar’s analysis of errors across 1,000+ projects consistently puts this context issues in the top ten. When you pass a method as a callback, this no longer refers to the original object.
| Approach | Fixes this? | When to Use |
|---|---|---|
.bind(this) | Yes | Older codebases, class components |
| Arrow function | Yes | Most modern JS, preferred approach |
const self = this | Yes | Legacy code only |
Arrow functions inherit this from the surrounding lexical context. In most cases, just converting callbacks to arrow functions resolves the issue with no extra code.
Direct State Mutation in React
Mutating state directly is one of those bugs that’s tricky to spot because the mutation works, the value changes, but React doesn’t trigger a re-render because the object reference didn’t change.
Wrong: state.items.push(newItem)
Right: setState([…state.items, newItem])
Same issue appears with objects: modifying a property directly won’t trigger updates. Always return a new reference.
JavaScript Debugging Best Practices

Most debugging time isn’t spent using clever tools. It’s spent on problems that better habits would have prevented.
JetBrains’ 2023 Developer Ecosystem Survey found that 32% of JavaScript developers skip unit tests entirely. That’s a lot of preventable bug-hunting hours. The practices below don’t eliminate debugging, but they make it significantly shorter when it happens.
Write Smaller, Testable Functions
A function that does one thing is a function you can test and isolate. When a bug appears in a 200-line function with three nested loops and a side effect, good luck pinpointing it.
Keep functions under 20-30 lines where possible. Name them clearly so the intent is obvious without reading the implementation. I prefer one return point per function wherever it doesn’t make the logic contorted, mainly because it makes stepping through with a debugger much cleaner.
Use TypeScript to Catch Errors Early
TypeScript adoption hit 78% among JavaScript developers in the 2024 State of JavaScript survey. There’s a reason. Static typing catches entire categories of bugs at compile time before the code ever runs.
TypeError issues, accessing properties on undefined, passing the wrong argument type to a function, all of these surface as editor errors rather than runtime crashes. The tradeoff is setup time and occasional type wrestling, but for any codebase that’s going to grow, it’s worth it.
Run ESLint and Prettier on Every Commit
ESLint remains the standard for JavaScript static analysis in 2024 (LogRocket). Configure it with no-undef, no-unused-vars, and eqeqeq at minimum. The eqeqeq rule alone, enforcing === over ==, eliminates a category of subtle type coercion bugs that are notoriously hard to trace.
Run ESLint as a pre-commit hook via Husky. Problems that don’t make it past the commit stage don’t become production bugs.
Write Tests Before You Debug
Jest is the testing framework of choice for 40% of JavaScript developers who write tests, according to JetBrains 2023 data. Vitest is gaining ground fast, particularly in Vite-based projects.
When a bug is reported, write a failing test that reproduces it first. Then fix the code until the test passes. This approach does two things: confirms you’ve actually fixed the root cause, and prevents the same bug from coming back silently in a future refactor.
Test-driven development works best when it’s part of the workflow from the start, not added retroactively. But even adding tests only for bugs gives you meaningful code coverage over time.
Use Git Bisect to Find Regressions
Something broke and you don’t know when. Git bisect runs a binary search through your commit history to find the exact commit that introduced the issue. Massively underused.
Run git bisect start, mark the current broken commit as bad, mark a known-good commit as good, and Git does the rest. Each step it checks out a middle commit; you test and mark it good or bad. Usually takes fewer than 10 steps to narrow down hundreds of commits.
Works best when paired with a source control discipline of small, focused commits rather than large multi-feature merges.
FAQ on Debugging JavaScript
What is JavaScript debugging?
JavaScript debugging is the process of finding and fixing errors in JavaScript code. It covers syntax errors, runtime exceptions, and logic failures. Developers use browser DevTools, breakpoints, and error monitoring tools like Sentry to locate and resolve issues efficiently.
What are the most common JavaScript errors?
The most frequent are TypeError, ReferenceError, and SyntaxError. TypeError usually appears when accessing a property on undefined. ReferenceError fires when a variable isn’t declared. Logic errors are the trickiest because JavaScript runs fine but returns wrong output.
How do I use breakpoints to debug JavaScript?
Open Chrome DevTools, go to the Sources panel, and click any line number to set a breakpoint. Execution pauses there. You can then inspect variables, step through code line by line, and use watch expressions to monitor specific values in real time.
What is the difference between console.log and a breakpoint?
console.log prints a snapshot value at a point in time. A breakpoint pauses execution so you can inspect the full variable scope, call stack, and program state interactively. Breakpoints are faster for complex bugs and don’t require modifying source code.
How do I debug asynchronous JavaScript?
Enable async stack traces in Chrome DevTools under Settings. Use try/catch around async/await blocks to handle promise rejections. The “Pause on caught exceptions” feature stops execution the moment any error is thrown, including inside async operations.
What are source maps and why do they matter?
Source maps link minified production JavaScript back to the original source files. Without them, stack traces point to unreadable compressed code. Tools like Webpack and Vite generate them automatically. Sentry can use source maps privately without exposing your source code publicly.
How do I debug JavaScript in Node.js?
Run Node with the –inspect flag to attach Chrome DevTools. VS Code’s built-in debugger also connects to Node via a launch.json config. Both support breakpoints, call stack inspection, and variable watching. The ndb tool by Google offers a cleaner alternative interface.
What tools help with JavaScript debugging in production?
Sentry captures runtime errors with full stack traces and user context. LogRocket records session replays so you can watch what happened before a crash. Datadog handles distributed tracing across services. All three integrate with source maps to show original code locations.
How do I fix “undefined is not a function” in JavaScript?
This TypeError means you’re calling something that isn’t a function. Common causes are this binding issues in callbacks, typos in method names, or accessing a method before the object is initialized. Use optional chaining (?.) and verify the variable type before calling it.
What are JavaScript debugging best practices?
Use linting with ESLint to catch errors before runtime. Write small, testable functions. Use unit tests with Jest or Vitest to catch regressions. Add TypeScript for static type checking. Run git bisect to pinpoint exactly which commit introduced a bug.
Conclusion
This conclusion is for an article presenting debugging JavaScript as a skill built on consistent habits, not just tool knowledge.
Understanding your error types, using breakpoints over scattered console.log calls, and setting up source maps for production will cut your debugging time significantly.
Async stack traces, ESLint, TypeScript, and error monitoring tools like Sentry handle the problems that catch most developers off guard.
The best investment you can make is catching issues earlier. Unit tests with Jest, static analysis, and git bisect for regressions all reduce the time spent firefighting in production.
Better debugging starts before the bug appears. Build the habits now.

- How to Run a React App in VS Code Step by Step - October 23, 2026
- Transactional or marketing email: which messages your app should send itself - October 23, 2026
- How Software Teams Write SOPs for Releases and Deployments - October 22, 2026