


Imagine pouring your soul into creating a mobile app, only to be met with a digital wall of silence post-launch. Why isn’t it clicking with users? It turns out, crafting an app is half the journey—the other half is mastering the art of app analytics.
Unearthing insights from metrics can be likened to panning for gold; it requires patience, precision, and the know-how to spot the shiny specks of user engagement and retention amidst the silt.
In the bustling ecosystem of Androids and iPhones, your app’s heartbeat is its performance data. From the quiet whispers of session duration to the loud rally cries of daily active users (DAU), these signals guide you to what works and what warrants a swift pivot.
By the wrap of this read, you’ll have charted a course through funnels and fires, armed with the prowess to elevate your app from surviving to thriving.
Dive into the crucible of A/B testing, eye the load times like a hawk, and decode the dance of in-app behavior.
What awaits is a dynamic sketch of your app’s success, stroked by the very users you seek to captivate.
Understanding App User Acquisition and Growth
User Growth Rate
When peering into how to measure mobile app performance, user growth rate is that star you can’t help but notice. It’s like watching a plant grow; you nurture it, you measure it.
Calculating user growth over time isn’t just about counting heads; it’s about charting the journey. Month on month, daily even, you want more users coming in than leaving—simple as that.
But hey, don’t kick back just yet. Look at launching campaigns, refining that App Store Optimization game.
For real, strategies for improving user acquisition are about getting creative and staying consistent. And about trends? They’re your storylines.
Summer might bring a surge—a new year could start quiet. Analyzing trends and seasonal variations means you predict the tides rather than just ride them.
Mobile Downloads
Downloads, that’s the loud buzz everyone hears. Higher numbers can feel like a pat on the back—confirmation that folks find your creation worth a slot on their screen. The significance of download numbers is they’re the first handshake between you and new users.
Yet, it’s not as simple as “build it, and they will come”. You’ve got factors influencing app downloads—visibility in app stores, word of mouth, even the color of your app icon, believe it or not.
Now, from visibility to an actual download, that’s the real game. Conversion tactics from visibility to download hinge on enticing your audience, making them believe, “This app, this is the one I need”.
Organic vs. Non-Organic Split
Diving into how to measure mobile app performance, you’re wading into the great debate of organic vs. non-organic split.
Organic growth is the dream—people stumbling upon your app naturally, loving it, sharing it. It’s authenticity and it resonates loudly. Then there’re paid campaigns, ads, the non-organic soldiers driving in users.
Your marketing strategies can kick-start that organic growth, get the ball rolling—the impact can be big.
And hey, don’t forget those users who come on their own are often the ones who stick around. Look into techniques to boost organic installs—improving search ranking within the app stores or leveraging social media buzz.
User Engagement and Retention
Session Length and Depth
Now, we get it. Beyond the buzz of user acquisition, it’s like, “Cool, they downloaded, but are they even into it?” That’s where we slide in with session length and depth.
It’s checking how long users hang out in the app, and what they’re diving into while there. It’s simple, really. Users sticking around longer, flipping through more pages, that’s a big thumbs up, right?
Here you are, tapping into this powerhouse metric when navigating how to measure mobile app performance.
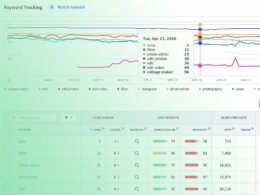
We’ve got tools cooking in the background, munching data and spitting out this gold — engagement analytics, heatmaps, all that jazz.
And bumping these numbers ain’t no accident; it’s strategy. Pump out juicy content, polish that UI until it shines. Because when the app feels good, users won’t just swipe and dash.
Active Users (DAU and MAU)
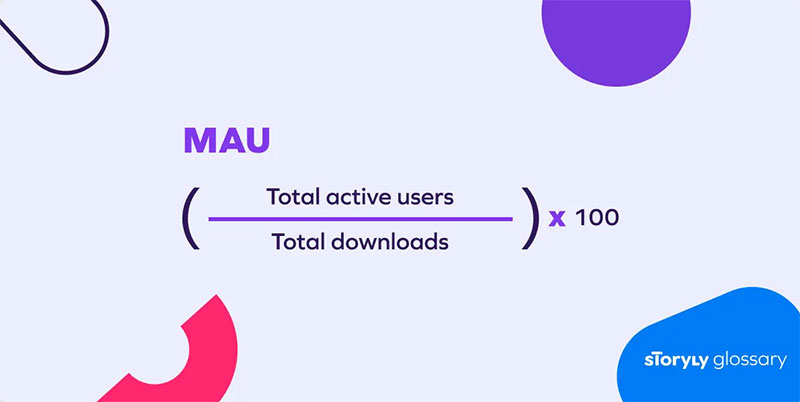
Okay, so check it. There’s like a pulse you want to keep tracking – that’s your DAU and MAU, your Daily and Monthly Active Users. It’s this heartbeat that hums, “Yup, folks are coming back.”
Flash some clever engagement strategies, and it’s like rolling out the red carpet for your users daily, monthly, keeping those numbers robust. Hit ’em with fresh features or reminders that nudge ’em back in.
They stick with you, your app’s a hit. Now when you’re up late fiddling with how to measure mobile app performance, these are the stats singing back to you, whispering notes of where the party’s at and who’s coming.
Stickiness Ratio
And then we’ve got this slick metric — the stickiness ratio. So, what’s the deal here? It’s all about making your app the one they can’t put down. Stickiness? It’s the superglue factor.
You want an app so catchy that they’ll want to double-tap it every chance they get. How do you whip up this magic?
Nail that user experience, keep ’em curious, always eager for the next swipe. Fire up those push notifications, but keep ’em witty. Get ’em chuckling, and you’ve got a fan for life.
Monetization and Revenue Generation
Average Revenue Per User (ARPU)

Okay, picture this: You’ve got this cool app, right? Users are digging it, but now you want that effort to start paying the rent.
That’s where ARPU sneaks in. It’s like taking the temperature, seeing if the bucks per user heat up or leave you cold.
how to measure mobile app performance when it comes to the green? Divide those earnings by active users, and there’s your number.
Get that ARPU to smile back at you, thinking ways to get users spending. Maybe it’s in-app purchases or subscriptions that unlock the cool stuff. Whatever it is, you want that ARPU gleaming.
Lifetime Value (LTV)
Let’s talk long game — Lifetime Value, or LTV. This baby’s the crystal ball of how much dough each user might bring over their stay.
Got users sticking for eons and spending? Jackpot, that LTV’s gonna sky-rock.
You’re scoping out how to measure mobile app performance financially, not just today or tomorrow, but down the road, like wayyy down. Boosting engagement, sparking joy with offers, it all counts, plumping up that LTV.
Conversion Rate
Ever thrown a party and worried if folks would show? That’s your conversion rate, right there.
It’s eyeing how many users who download or peep at your app actually pony up the cash for whatever you’re selling inside.
Now, whether this shindig’s a hit, it’s more art than science.
Zeroing in on how to measure mobile app performance here means crafting an experience smooth like butter, so when the time comes to open wallets, users won’t blink. It’s usability, allure, trust — the ingredients for happy conversions.
App Performance and Stability
App Crashes and Stability
Ever had an app crash on ya when you’re just getting into the groove? Annoying, isn’t it?
So preventing those party-poopers is top of the list when you’re all about how to measure mobile app performance. Stability is like the cool in your cola, the ice in your mojito—it’s gotta be there, or the whole experience fizzles out.
There’s a bunch of tools, right — like crash reporting utilities and performance monitoring solutions.
These are the lookout points, constantly scanning the horizon for trouble. Use ‘em to spot the buggy waters before your users do and navigate to smoother seas.
Load Speed and Performance Optimization
Now, imagine you’re ready to kick back, relax, and stream your favorite show, but the app’s just… loading… and… loading. Ugh! Load speed is the opposite of a waiting line. It’s your VIP pass to user happiness.
So, optimizing your app’s performance – it’s like tuning a guitar before a big gig, removing the drag to hit those high notes of smooth operation.
This isn’t just some nerdy back-end hustle. No, sir. It’s frontline, make-or-break stuff.
User Behavior and Interaction Analysis
Gestures and User Interactions
Here’s the thing; folks are chatting with your app through swipes and taps, like it’s Morse code or something.
Gestures and user interactions — they’re telling a story, whispering the secrets of how people really feel about your app.
From loving taps to frustrated swipes, each move’s a clue.
Unlocking those clues – that’s key to how to measure mobile app performance.
You got your analytics tools drawing up heat maps, tracking every prod and poke. This isn’t just about what buttons they push; it’s about understanding the ‘why’ behind each gesture.
Session Interval and Frequency
So, then there’s this rhythm – the beat of app usage. Hit me with the session interval and frequency.
It’s tracking when users drop in and how often they swing by. It’s sort of like knowing the visiting hours of your digital home.
The trick’s to turn these casual drop-ins into a regular hangout spot. Want to know a secret? It’s that cozy vibe that does the trick.
Whip up notifications that match their schedule, or scoop in features that sync with their lifestyle. That’s the ticket to winning the game of how to measure mobile app performance.
Identifying and Addressing Churn
Churn Rate Measurement
So, churn rate, it’s like the bouncer at the club of your app, counting the folks who bolt instead of rave.
Getting the lowdown on how to measure mobile app performance? Spot the stage-dive before it happens. Now, breaking it down, churn rate’s about tallying up the peace-outs over a spell and against the whole party crowd.
Knowing the ins and outs of user behavior analytics can spell out why users might be pulling the plug. Look at patterns, spot the snags, and you’ve got your battle plan against the churn.
Re-engagement Tactics

And hey, saying “bye” doesn’t have to be for good. Win back the hearts with some nifty re-engagement tactics.
Nudge ’em with a “Hey, remember us?” Get personal, slide them exclusive offers or flash a shiny new feature.
Dive into those push notifications or tap into email wizardry to rekindle that spark.
Watch them come back for more, turning those “almost-gonetown” tunes into “back for the encore.” That’s real talk on tackling how to measure mobile app performance—it’s not just glow, it’s got some clutch comebacks too.
FAQ on How To Measure Mobile App Performance
What metrics are crucial for mobile app performance?
Metrics, you see, are the compass that steer your app’s journey. Keep your eyes peeled for engagement metrics, especially retention rate and DAU/MAU. Load times can’t be overlooked—snappy is the keyword here. Conversion rate and LTV shed light on the financial health of your digital creation.
How do A/B testing and user feedback affect app performance?
A/B testing slices through assumptions, carving out data-driven paths for enhancement. It’s a direct line to what ticks with your audience. Meanwhile, user feedback’s a treasure trove, steering you clear of murky waters, right into the sweet spot of user experience optimization.
Can you explain the significance of in-app behavior analytics?
In-app behavior’s like the pulse of your app—every tap, swipe, and pause a beat. Keep tabs on this rhythm with heatmaps and screen flow analysis, they paint a story of user journeys, highlighting friction and feverish activity zones alike. That’s intel you can’t afford to sail without.
Does app store optimization (ASO) play a role in app performance?
Oh, ASO isn’t just a role—it’s the leading act! Nail this and watch your app soar up the ranks in the Google Play Store or Apple App Store. Think of it as your app’s front door décor, inviting users in with screenshots, keywords, and compelling descriptions.
What’s the deal with load times and app crashes?
Imagine you’re on stage and forget your lines—app crashes and slow load times are just as disastrous. These gremlins can tank your show, undercutting user tolerance levels. Shun them with rigorous testing, real user monitoring, and tenacious optimization.
How do I measure user acquisition cost effectively?
Got a calculator handy? It’s all about balancing equations here. Track your marketing expenditures and tally up the new users lured in during the same timeframe. Voilà, your acquisition costs crystallize. Keep ’em low relative to LTV, or you’ll be navigating through stormy seas.
Why is it important to benchmark app performance?
Sea captains of yore navigated by the stars; app devs benchmark. It’s vital to assess where you stand amid the vast app ocean. Pinpoint your app’s strengths and weather its weaknesses by comparing against industry standards and those top chart contenders.
Can you elaborate on the relevance of session duration?
Session duration whispers tales of user enchantment. It’s a glimpse into how long users are willing to cast anchor in your app’s harbor. Longer sessions usually nod towards compelling content or features, while shorter ones might signal rough seas ahead.
How do cohort analysis and funnel analysis differ?
Set your eyes on cohort analysis and you’re tracking user behavior over time, spotting patterns, and predicting trends. Now, switch your gaze to funnel analysis, and you’re dissecting the conversion journey, isolating choke points where users hit the deck and abandon ship.
What are the best tools for measuring mobile app performance?
On deck are titans like Google Analytics for Mobile and Firebase, offering deep dives into users’ in-app escapades. Mixpanel and Flurry Analytics keep you savvy on user behavior while App Annie hoists the flag high for competitive insights. These tools are the musketeers of the app performance realm.
Conclusion
In the realm of digital craftsmanship, nailing how to measure mobile app performance is akin to a maestro fine-tuning an orchestra. It’s not just about watching numbers tick upward but grasping the symphony of user interactions, retention harmonies, and engagement crescendos. The right blend of A/B testing, cohorts, and funnel logic plays out in a rhapsody of optimization.
To close, imagine a dashboard aglow with the very stats that distill user joy and frustration into actionable insights. Think of analytics tools as your telescope to the stars of user experience, helping navigate the vast app universe.
- Engagement tells us if we’ve struck a chord.
- Retention rates hint at the encore demand.
- Load times and crashes pull back the curtain on technical excellence.
The baton’s in your hands; lead your app to standing ovations with every update, guided by the stardust of data-driven decisions.
If you liked this article about how to measure mobile app performance, you should check out this article about app store keywords best practices.
There are also similar articles discussing Google Play A/B testing, in-app feedback, app store rating, and mobile app growth.
And let’s not forget about articles on improving app store conversion rate, Google Play store fees, Apple app store fees, and how to publish an app on Google Play.
With over a decade in the tech field, Bogdan blends technical expertise with insights on business innovation in technology.
A regular contributor to TMS Outsource's blog, where you'll find sharp analyses on software development, tech business strategies, and global tech dynamics.
- Design Digitally: Graphic Design Apps Like Adobe Illustrator - May 4, 2024
- Unlocking Efficiency: Top CSS Generators To Try - May 4, 2024
- What Is Rust Used For? A Guide to Its Applications - May 4, 2024