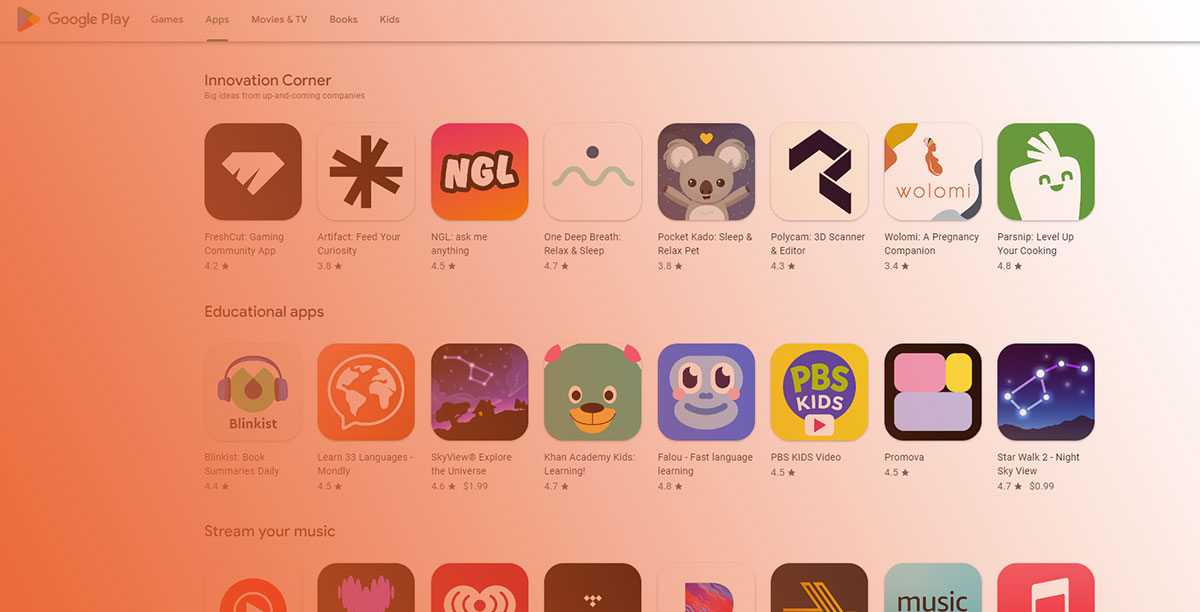
Your app icon, screenshots, and description are doing the selling before users ever open your app. If those assets aren’t converting, you’re losing installs you already earned the traffic for. Google Play A/B testing gives you a way to fix that with real data instead of guesses.
Google Play Console includes a free built-in tool called store listing experiments. It splits your organic traffic between your current listing and a variant, then measures which version drives more first-time installers.
This guide covers how store listing experiments work, which elements impact conversion rates most, how Google measures statistical significance, and how to avoid the common mistakes that waste weeks of testing. Whether you’re running your first experiment or building a long-term optimization program, you’ll find specific benchmarks and real case studies to work from.
What Is Google Play A/B Testing
Google Play A/B testing is the built-in experimentation feature inside Google Play Console that lets developers compare different versions of their store listing against a control group. Google calls these “store listing experiments.”
The concept is straightforward. You create a variant of a specific element (your app icon, screenshots, description), and Google Play splits incoming traffic between your current listing and the new version. Real users on the Play Store see one version or the other, and Google tracks which drives more installs.
This differs from general A/B testing you might run on a website or inside an app. Store listing experiments operate specifically on your Google Play page, measuring how changes to visual or text assets affect download behavior. The traffic comes from organic Play Store visitors, not paid campaigns or simulated environments.
AppTweak data from 2024 shows the average conversion rate across all categories on US Google Play was 27.3%. That number swings wildly by category. Auto & Vehicles hit 70.5%, while Board Games sat at just 7.3%.
Those gaps are exactly why testing matters. A single icon swap or screenshot reorder can push your listing’s conversion rate several points in either direction, depending on your category and audience.
Google Play experiments only affect new visitors. Existing users who already installed your app won’t see the test variants. The system tracks first-time installers and retained first-time installers (users who keep your app installed for at least one day) as its core metrics.
You can run experiments in up to five languages and test one element at a time or compare up to three variants against your control. Google recommends testing a single asset per experiment to isolate what actually caused the change.
For anyone working in Android development, understanding how store listing experiments fit into the broader app lifecycle is worth the time. The feature is free, built directly into Play Console, and requires no code changes or new app builds to run.
Store Listing Experiments in Google Play Console

Store listing experiments are the primary A/B testing method available to Android developers. They live inside the Google Play Console under “Grow users,” and they cover the visual and text assets that make up your Play Store page.
Testable Elements
App icon: The first creative element users encounter. In search results, the icon may be the only visual a user sees before deciding to tap or scroll past. SplitMetrics’ 2024 ASO Benchmarks report found that optimized app icons can boost user acquisition by up to 25%.
Screenshots: These preview your app’s key features and user experience. AppTweak’s 2025 ASO report showed 57% of top games on Google Play A/B tested their screenshots at least twice in 2024.
Feature graphic and preview video: The feature graphic overlays the preview video and appears before screenshots, taking up most of the visible area on the listing page.
Short description: Up to 80 characters, displayed below your app title. Affects keyword indexing on Google Play.
Long description: The 4,000-character text block. Less visible than visual assets but still a factor in how Google Play indexes your app for search.
Default Graphics Experiments vs. Localized Experiments
Google Play Console offers two experiment scopes, and they behave differently.
| Experiment Type | Scope | Best For |
|---|---|---|
| Default graphics | All visitors see test variants | Global creative changes |
| Localized | Specific language audiences | Regional positioning, translated assets |
Default graphics experiments test creative assets that all visitors can see. Localized experiments target users based on their language settings.
One tricky thing to watch: setting a localized experiment for “French (France)” doesn’t limit your test to users in France. Anyone worldwide with French set as their device language will be included. If you want both country-specific and language-specific targeting, you’d need to combine localized experiments with custom store listings.
The Google Play store screenshot sizes documentation covers exact dimensions and format requirements for each asset type, which is worth reviewing before you start designing variants.
How Google Play Measures Statistical Significance
Google Play experiments use a 90% confidence interval by default. That means if you ran the same experiment ten times, nine out of ten runs would produce a result falling within the reported range.
A 90% confidence level also means a 10% significance level, which is higher than the 95% standard used in most A/B testing contexts. That 10% error margin is not small.
What the Confidence Interval Actually Tells You
When Google Play shows your experiment results, you’ll see a range like “+4.5% to +15.3%.” That’s the confidence interval. It means you can be 90% sure the true conversion change falls somewhere in that range.
If the range crosses zero (something like “-3.3% to +6.1%”), you can’t conclude that your variant is actually better. The true effect might be negative.
Google uses jackknife resampling to calculate these intervals and applies mixture sequential probability testing to control false positive rates from continuous monitoring. Statistical significance is determined when the confidence interval doesn’t intersect with zero.
Minimum Detectable Effect
Google added a minimum detectable effect (MDE) setting to experiments in 2022. This lets you specify the smallest conversion change worth detecting.
If you set your MDE to 5% and your control converts at 45%, your variant needs at least a 47.25% conversion rate to be declared the winner. Lower MDE values require more traffic and longer test durations but catch smaller improvements.
Practical benchmark: ASO practitioners report that results tend to stabilize after 8,000 to 10,000 installs per variation. Apps with lower daily install volumes will need to run experiments for weeks, sometimes months, before reaching reliable conclusions.
Google Play Console now shows estimated days to completion based on your settings. The calculation factors in your app’s historical traffic, the number of variants, your chosen confidence level, and the MDE.
Running a software test plan that accounts for these statistical requirements helps prevent premature decisions. Stopping an experiment too early is one of the most common mistakes, and it leads to applying changes based on noise rather than real user preferences.
Which Store Listing Elements Impact Conversion Rates Most
Not every element on your Play Store listing carries the same weight. Testing the right thing first saves weeks of experiment time.
App Icon
The icon produces the biggest conversion swings. It’s the only visual element that shows up in every placement: search results, browse sections, top charts, and the listing page itself.
SplitMetrics’ 2024 report found that icons with clear, simple backgrounds increased conversion rates by over 26% across categories. SitePoint documented a case where the difference in conversions between the best and worst icon variant was fourfold. The developer’s least favorite design performed best.
REPLUG’s ASO team ran icon A/B tests in early 2025 for Golden Surveys and MultiPolls, driving a +13.4% increase in retained installs. The takeaway: test your icon first, always.
Screenshots
Screenshots rank second in impact. Most users never scroll past the second screenshot, which puts enormous pressure on the first image.
Sensor Tower published a case study on the SKODA Little Driver app where simply reordering screenshots led to a 16.6% increase in installs. No design changes. Just a different sequence.
The textPlus case is even more dramatic. SplitMetrics documented how a single screenshot A/B test generated over 119,000 additional downloads.
When designing screenshot variants, think about how your app communicates its purpose through those first few frames. If you’re building apps that follow Material Design principles, your screenshots should reflect that consistency.
Short Description and Long Description
Text changes produce smaller conversion lifts compared to visual assets. That’s predictable. Most users don’t read descriptions before installing.
But the short description (80 characters) sits right below the title and is visible without scrolling. Testing a benefit-driven short description against a feature-list version can sometimes move the needle, especially in utility or productivity categories where users compare multiple options.
Long description testing is mostly useful for keyword indexing on Google Play rather than direct conversion impact.
Feature Graphic and Preview Video
The feature graphic takes up significant screen space. It matters most for browse traffic (users exploring categories or featured sections) and less for search traffic, where users tend to focus on the icon and title.
If your app gets a large share of installs from search, prioritize icon and screenshot testing over the feature graphic.
Running an A/B Test on Google Play Step by Step
Setting up a store listing experiment takes about ten minutes. Getting useful results takes discipline and patience.
Setup Walkthrough
Step one: Open Google Play Console and go to Grow users > Store listing experiments. Create a new experiment and name it something specific (“IconBlueBgvsWhiteBgMarch2026″ beats “Test 1”).
Step two: Choose the experiment type (default graphics or localized) and select which element to test.
Step three: Upload your variant assets. You can test up to three variants against the control.
Step four: Set your traffic split. Google recommends an even split between control and variant for faster results. A 50/50 split with one variant is the fastest path to statistical significance.
Step five: Configure your experiment goals. Select the target metric (first-time installers or retained first-time installers), confidence level, and minimum detectable effect.
Step six: Launch. Google will show estimated days to completion based on your settings.
Google advises running experiments for at least seven days to account for weekday versus weekend traffic patterns. That’s the bare minimum.
Common Setup Mistakes That Invalidate Results
Testing multiple elements simultaneously. If you change the icon and screenshots in the same experiment, you can’t isolate which change caused the result. Test one variable at a time.
Stopping early. A variant might look like a winner on day three, then regress to neutral by day ten. Wait for the confidence interval to stabilize.
Running paid campaigns during the test. Ad traffic skews the organic visitor pool that Google uses for experiments. Keep your ad spend steady (or pause campaigns) while the experiment runs.
Wrong language targeting. Setting “EN-US” as the experiment language doesn’t restrict it to American users. It includes everyone worldwide with English (US) as their device language.
Bending Spoons’ Luca Giacomel has pointed out that running multiple A/B tests in parallel creates a statistical problem called “multiple comparisons,” which reduces confidence across all simultaneous experiments. Stick to one experiment at a time.
If you’re managing experiments as part of a broader development workflow, having a clear software development plan helps coordinate when experiments run alongside feature releases and app deployment schedules.
Google Play A/B Testing vs. Third-Party ASO Tools
Google Play’s native experiments are free and use real store traffic. But they’re not the only option. Platforms like SplitMetrics and StoreMaven have been doing app store A/B testing longer than Google’s tool has existed.
How Native and Third-Party Tools Differ
| Feature | Google Play Experiments | SplitMetrics / StoreMaven |
|---|---|---|
| Cost | Free | Starting ~$14,500/year |
| Traffic source | Real organic Play Store visitors | Paid traffic to simulated store pages |
| Pre-launch testing | No | Yes |
| Behavior analytics | Installs, retention (1-day) | 15+ metrics including scroll depth, heatmaps |
| Cross-platform | Android only | iOS and Android from one dashboard |
The biggest advantage of Google Play’s native tool is the traffic source. Real users in the actual Play Store behave differently than users clicking through a paid ad to a simulated store page. That organic behavior is hard to replicate.
Third-party tools solve a different problem. They let you test before publishing, which means you don’t risk tanking your live conversion rate with an untested design.
When Third-Party Tools Make Sense
If you’re about to do a full visual rebrand, testing in a controlled environment first reduces risk. SplitMetrics documented how Prequel achieved a 75% improvement in conversions through pre-launch video A/B testing without affecting their live listing.
Third-party platforms also give you more granular behavioral data. Google tells you how many people installed. SplitMetrics tells you how far they scrolled, which screenshot they paused on, and how long they spent on the page.
For apps with low organic traffic (under a few hundred daily installs), Google Play experiments can take months to produce reliable results. Paid traffic tools speed that up because you control the volume.
But here’s the catch. SplitMetrics’ entry-level plan starts at $14,500 per year. StoreMaven doesn’t publish pricing at all. For indie developers or small studios, that’s a hard sell when Google’s tool is free.
Also worth noting: iOS and Android users behave differently. SplitMetrics themselves warn against applying Google Play test results to the App Store. If you ship on both platforms, you need separate experiments for each. The mobile application development process should account for platform-specific store optimization as a distinct phase, not an afterthought.
Booking.com runs over 1,000 A/B tests at any given time across its web properties, with 80% of product changes informed by experiments. That level of testing culture is what separates apps that grow from apps that guess.
Sample Size and Experiment Duration Benchmarks

The most common question about Google Play store listing experiments: how long should I run the test? The answer depends on your app’s daily install volume, and most developers underestimate the time required.
Minimum Traffic Thresholds
Google Play Console now shows estimated days to completion when you configure an experiment. That estimate factors in your historical traffic, selected confidence level, number of variants, and the minimum detectable effect you’ve set.
ASO practitioners generally agree that results start to stabilize after 8,000 to 10,000 installs per variation. That’s current installs, not scaled installs (the projected number Google calculates as if one variant received all traffic).
For an app getting 500 organic installs per day with a 50/50 traffic split, reaching 10,000 installs per variant takes about 40 days. An app with 100 daily installs? That same experiment runs for close to seven months.
Why Low-Traffic Apps Face a Structural Problem
Apps with fewer than a few hundred daily installs can’t reliably run store listing experiments in any practical timeframe. The math works against them.
A smaller sample needs a longer duration. But longer durations introduce external noise: seasonal shifts, competitor actions, changes in the Google Play store ranking algorithm, and fluctuating ad spend from other channels.
RevenueCat’s 2024 analysis pointed out that most apps simply don’t have enough traffic to run statistically significant A/B tests. Their recommendation for low-traffic apps: use qualitative research methods (user interviews, prototype testing) instead of waiting months for unreliable quantitative results.
Seasonality and External Factors
| Factor | Impact on Experiment | How to Handle |
|---|---|---|
| Holiday traffic spikes | Inflates install volume, skews behavior | Avoid starting tests during peak seasons |
| Paid campaign changes | Alters organic visitor mix | Keep ad spend steady during tests |
| Competitor launches | Shifts browse and search traffic | Monitor category trends during test |
| App updates | New reviews/ratings affect conversion | Avoid major releases mid-experiment |
Google recommends running experiments for at least seven days to capture weekday and weekend traffic patterns. That’s a floor, not a target. Two to four weeks is more realistic for most apps.
If your app handles real user data across multiple regions, using a software test plan that coordinates experiment timing with your software release cycle prevents experiments from colliding with feature rollouts.
A/B Testing Custom Store Listings
Custom store listings (CSLs) are a separate feature from store listing experiments, but they overlap in ways that matter for conversion optimization.
What Custom Store Listings Do
CSLs let you create up to 50 different versions of your Play Store page, each targeted at a specific audience. You can customize the app name, icon, descriptions, screenshots, and videos for each version.
Targeting options include:
- Country or region
- User install state (new users, inactive users, pre-registration)
- Search keywords (added in 2025)
- Google Ads campaign IDs
Google Play Console published a case study showing that India-based social platform Koo increased organic installs by 15% through language-based custom store listings that matched the user’s native language.
How CSLs Differ from Store Listing Experiments
Purpose matters here. Store listing experiments test which version performs better with the same audience. Custom store listings show different content to different audiences permanently.
You’re not comparing variant A against variant B. You’re saying “users in Brazil see this page, users in Germany see that page.”
The scale difference is significant too. Your main store listing allows five simultaneous experiments. But each of your 50 CSLs can run five experiments independently. That’s potentially 250+ parallel tests, according to ASOMobile’s 2025 analysis.
Using CSLs Alongside Experiments
The smart approach combines both features. First, use store listing experiments on your default listing to find what converts best for your general audience. Then create custom store listings for specific segments and run separate experiments on those.
Phiture’s work with Lockwood Publishing on Avakin Life produced a 57% increase in conversion rates over two months by combining tailored CSLs with data-driven creative optimization.
In 2025, Google introduced the ability to target inactive users through CSLs, defined as people who downloaded your app more than 28 days ago and haven’t opened it in the last 28 days. This opens up re-engagement testing you couldn’t do before.
If you’re managing multiple store listing variants across regions while also coordinating your software development process, tracking which experiments run on which listings gets complicated fast. A spreadsheet or project board dedicated to experiment tracking saves headaches.
Interpreting and Acting on A/B Test Results

Getting experiment data is the easy part. Making the right call based on that data is where most teams stumble.
Reading the Results Dashboard
Google Play Console shows three key metrics for each experiment variant:
Current installs: The actual number of installs each version received during the test.
Scaled installs: A projected number showing what you’d have gotten if only one version was running. With a 50/50 split, scaled installs are roughly double the current installs.
Confidence interval: The range where Google believes the true conversion difference falls, at your chosen confidence level.
The confidence interval is what matters most. If the entire range sits above zero (like +4.5% to +15.3%), your variant likely outperforms the control. If the range crosses zero (-3.3% to +6.1%), the result is inconclusive.
When a “Winner” Isn’t Really a Winner
A variant showing a positive result doesn’t always justify applying it. Here’s what to check.
Google Play experiments default to a 90% confidence level, which means a 10% chance your result is a false positive. ASO expert insights from seoasoorm.com suggest always running tests twice or using an A/B/B setup (two identical B variants) to verify results are not random noise.
Watch the minimum detectable effect too. If your MDE is set to 5% but your result shows a +2% lift, the experiment wasn’t sensitive enough to reliably detect that change. The “win” might be statistical noise.
Splendid Apps used store listing experiments to validate creative changes and saw a 9% revenue increase after systematically applying only results that hit statistical significance, according to a Google Play Console case study.
Building an Iterative Testing Strategy
One successful experiment is a data point. A testing program is what actually moves your conversion rate over time.
Document everything. Record the hypothesis, variant designs, traffic split, duration, confidence interval, and outcome for every experiment. This history becomes your playbook.
Test in priority order. Icon first, then screenshots, then feature graphic, then text. Each test builds on what you learned from the last one.
Revisit old winners. An icon that won six months ago might not perform the same way today. User expectations shift, competitors update their listings, and seasonal trends change behavior. AppTweak’s 2025 ASO report found that top apps update their screenshots two to four times per year to stay competitive.
After applying a winning variant, monitor your conversion rate in the Store Performance section of Play Console. Go to Grow > Store Performance > Listing Conversion Analysis to track how the change performs on real, unfiltered traffic.
If your post-experiment conversion rate drops instead of matching the test results, revisit the experiment parameters. Either the sample size was too small, external factors skewed the data, or the variant performs differently at full traffic volume.
The whole process fits into a broader approach to building and improving apps. Teams that follow a clear mobile app development process tend to treat store listing optimization as a continuous phase rather than a one-time task. That mindset shift, from “launch and forget” to “launch, test, and iterate,” is what separates apps that grow their install base from apps that plateau.
How much you invest in each round of testing ties back to your overall mobile app development cost planning. Budget for ongoing creative production alongside your experiment calendar, because every test needs fresh variants to compare.
FAQ on Google Play A/B Testing
What is Google Play A/B testing?
It’s the built-in experimentation feature inside Google Play Console that lets you test different versions of your store listing against a control group. Google splits organic traffic between variants and tracks which one drives more installs.
How much does it cost to run store listing experiments?
Nothing. Store listing experiments are completely free inside Google Play Console. You don’t need third-party tools or paid traffic to run them. The feature is available to any developer with a published app.
Which store listing elements can I A/B test?
You can test your app icon, screenshots, feature graphic, preview video, short description, and long description. Google recommends testing one element at a time to isolate what caused any change in conversion rate.
How long should a Google Play experiment run?
At least seven days to cover weekday and weekend traffic patterns. Most experiments need two to four weeks for reliable results. Low-traffic apps may need even longer to reach statistical significance.
What confidence level does Google Play use?
Google Play defaults to a 90% confidence interval. You can adjust this to 95%, 98%, or 99%. Higher confidence levels reduce false positives but require more traffic and longer experiment durations.
How many variants can I test at once?
Up to three variants against your current control listing. But testing fewer variants (ideally just one) produces faster, cleaner results. Multiple variants split your traffic thinner and extend the time needed.
Do store listing experiments affect existing users?
No. Experiments only target new visitors who haven’t installed your app yet. Existing users won’t see the test variants. Google tracks first-time installers and retained first-time installers as its core metrics.
What is the minimum detectable effect in Google Play experiments?
The MDE is the smallest conversion change your experiment can reliably detect. A lower MDE catches smaller improvements but needs more traffic. Google Play Console lets you configure this value during experiment setup.
Can I run A/B tests on custom store listings?
Yes. Each of your 50 custom store listings can run up to five experiments independently. This gives you far more testing capacity than the five experiments allowed on your main default listing.
What is the difference between Google Play experiments and third-party ASO tools?
Google Play experiments use real organic store traffic and are free. Third-party tools like SplitMetrics use paid traffic on simulated pages but offer pre-launch testing and deeper behavioral analytics.
Conclusion
Google Play A/B testing removes the guesswork from app store optimization. Every icon, screenshot, and description change should be validated through store listing experiments before going live.
The data backs this up. Apps that treat conversion rate optimization as an ongoing process consistently outperform those that set their listing once and walk away.
Start with your app icon. It produces the largest conversion swings. Then move to screenshots, feature graphics, and text elements in that order.
Pay attention to statistical significance. A 90% confidence interval with a 10% error margin means you should verify results through repeated testing or A/B/B setups.
Low daily install volume makes experiments harder, not impossible. Adjust your minimum detectable effect and accept longer test durations rather than skipping experimentation entirely.
The Play Store has over two million apps competing for attention. Testing your store listing assets through Google Play Console is the most direct way to turn existing traffic into more installs without spending a dollar on paid user acquisition.

- MongoDB Cheat Sheet - October 20, 2026
- Adding AI Video Generation to a Software Product: Architecture, Cost Guardrails and QA - October 20, 2026
- Show Hidden Characters, Spaces, and Line Endings in Notepad++ - October 19, 2026