Imagine a tapestry of data, woven intricately with lines, colors, and shapes that tell a powerful story without uttering a single word. That’s the artistry of JavaScript charting libraries, a cornerstone in the toolkit of modern web design.
In the digital narrative, where data is the protagonist, these libraries turn complex information into accessible and engaging visuals.
Dipping our brushes into the rich palette of web development, this article demystifies the craft of creating vibrant and interactive data visualizations. Harnessing libraries such as Chart.js, D3.js, and Highcharts, you’ll unravel the secrets to presenting data with both aesthetic appeal and functional prowess.
By the conclusion, be ready to transform raw numbers into stunning, storytelling charts that leap off the screen. From dynamic charting interfaces to SVG chart solutions, we cover the spectrum.
Expect to emerge with a vault of techniques for leveraging JavaScript charting libraries to their full potential, crafting visualizations that are not only informative but resonate with users far and wide.
| JavaScript Charting Library | Chart Types | License | Ease of Use | Customizability | Interactivity |
|---|---|---|---|---|---|
| Nivo | Rich | MIT | Moderate | High | High |
| Pie | Limited | MIT | Easy | Moderate | Moderate |
| Victory | Rich | MIT | Moderate | High | High |
| Recharts | Rich | MIT | Easy | High | High |
| FusionCharts | Extensive | Paid/Free | Easy | High | High |
| Chart.js | Basic to Rich | MIT | Easy | High | Moderate |
| Cytoscape | Network graphs | MIT | Moderate | High | High |
| Highcharts | Extensive | Paid/Free | Moderate | High | High |
| D3.js | Extensive | BSD-3-Clause | Complex | Max | High |
| ApexCharts | Rich | MIT | Easy | High | High |
| Chartist | Basic to Rich | LGPL-3.0 | Easy | Moderate | Moderate |
| CanvasJS | Rich | Paid | Easy | High | High |
| ZingChart | Extensive | Paid/Free | Moderate | High | High |
| Dygraphs | Time-series | MIT | Easy | Moderate | Moderate |
| amCharts | Extensive | Paid/Free | Easy | High | High |
| Google Charts | Rich | Free | Easy | Moderate | High |
| Charted | Basic | Free | Easy | Low | Low |
| Billboard | Rich | MIT | Easy | High | High |
| ECharts | Extensive | Apache-2.0 | Moderate | High | High |
| Bullet | Basic | Various | Moderate | Moderate | Low |
| C3 | Rich | MIT | Moderate | Moderate | High |
| Nvd3 | Rich | Apache-2.0 | Moderate | Moderate | Moderate |
JavaScript Charting Libraries
Nivo
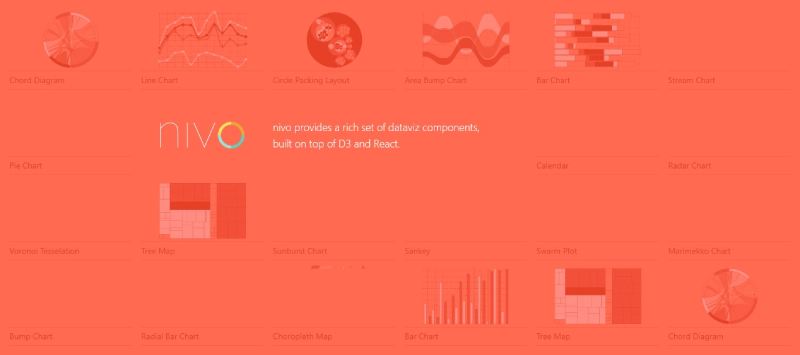
Nivo slides in with a compelling case for those seeking rich, interactive data visualizations in their React applications. Tapping into the powerful D3.js underpinnings, Nivo offers a sweeping array of beautiful chart components with a strong emphasis on design and ease of use. It is a stellar intersection of aesthetics and functionality.
Best Features
- Wide variety of chart types
- Responsive and interactive
- Extensive customization options
What we like about it:
Nivo’s bar-to-entry is all but a mere hop, thanks to its React-based framework. This allows for a smooth blend into the ecosystem, making it a prime candidate for crafting exquisite visual narratives.
Victory
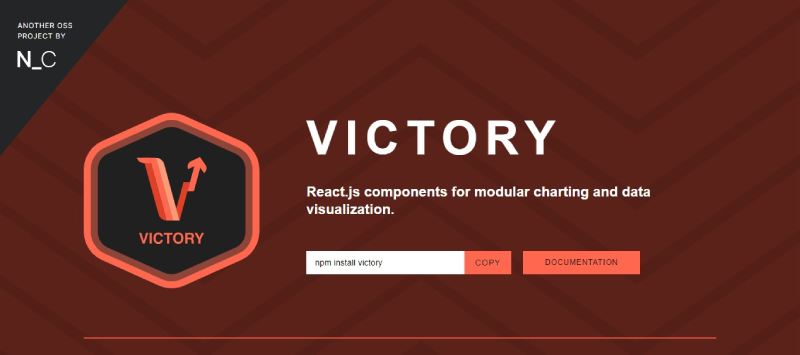
Victory charts a path for developers who crave sophistication without the complexity. Its modular structure defines a new narrative in building complex charting interfaces. A foundation in React paves the way for easy integration into modern web applications, accompanied by the promise of flexibility.
Best Features
- Composable components
- Customizable styles
- Native SVG support
What we like about it:
Victory’s trump card is composability; it invites creativity. Every chart becomes a Lego set of possibility – stackable, interchangeable parts, coming together in a bespoke data storytelling tool.
Recharts
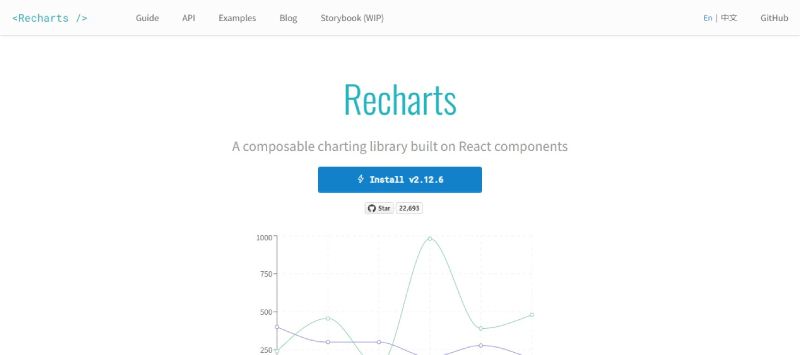
Recharts weaves simplicity into the heart of React with its minimalist, component-based approach to charting. Paint a picture with your data through a library that strikes an ideal balance between ease-of-use and composability, all springing from the well of React components.
Best Features
- Lightweight and easy to use
- Declarative components
- Great integration with React
What we like about it:
What clinches the win for Recharts is how it harmonizes with the React principles, elevating it as the intuitive choice for developers nesting comfortably in the React ecosystem.
FusionCharts
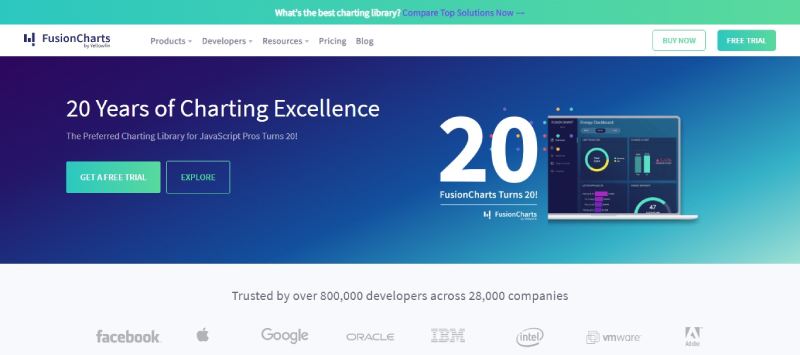
FusionCharts is a treasure trove of data visualization. Its ability to illuminate data across a vast expanse, from simple charts to elaborate dashboards, makes it a favored tool among many. Compatibility whispers across platforms and devices, turning data representation into a smooth dialogue.
Best Features
- Extensive chart collection
- Cross-device compatibility
- Real-time data support
What we like about it:
The breadth and depth FusionCharts offers through its extensive chart collection spark curiosity and invites discovery. It cultivates a boundless playground for data.
Chart.js
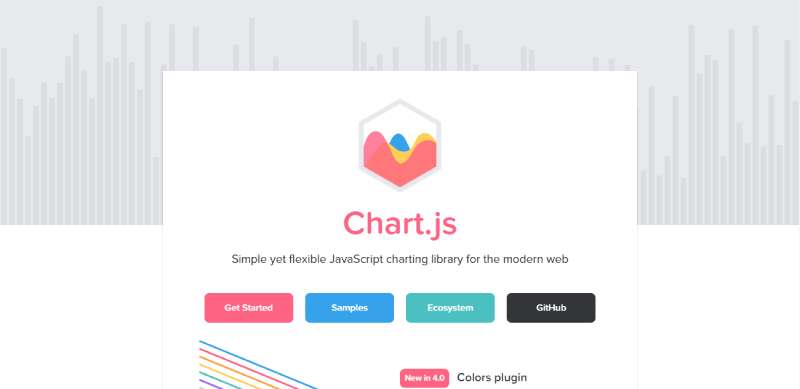
Chart.js plots its course with the charm of simplicity and the strength of clear, approachable documentation. Peer into this lightweight canvas-based library to craft elegant charts with a crisp aesthetic that turbocharges the narrative without the bloat.
Best Features
- Responsive and interactive
- Canvas rendering for performance
- Comprehensive documentation
What we like about it:
Chart.js prides itself on simplicity and rendering performance, striking an admirable balance that resonates with novices and veterans alike in the web design sphere.
Cytoscape
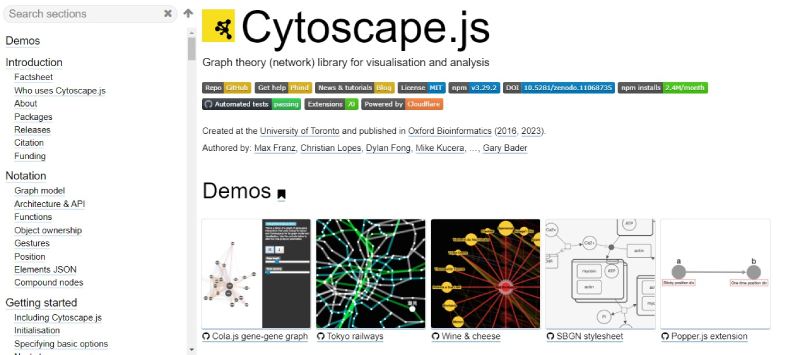
Cytoscape unfurls as the maestro of network visuals. Spinning a web of connections with its robust graph theory library, it carves a niche where relationships are central. For projects demanding intricate displays of interconnected data, Cytoscape’s fluid dance with complexity shines.
Best Features
- Complex network visualizations
- Extensive graph theory algorithms
- High degree of interactivity
What we like about it:
The tool’s prowess in turning abstract connections into visual masterpieces secures its place as a leading voice in complex network visualization conversation.
Highcharts
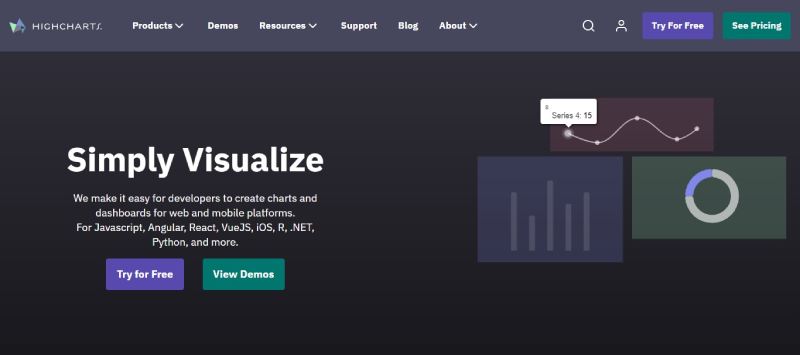
Highcharts speaks the language of interactivity with an eloquence befitting of royalty. Immersing users in a vast array of chart types, it spins data stories seamlessly across devices. Touch the fabric of sophisticated analytics with charts that are both visually stunning and astoundingly intuitive.
Best Features
- Wide array of chart types
- Interactive and responsive
- Accessibility features
What we like about it:
What truly sets Highcharts apart is its commitment to accessibility, opening the gates of data visualization to a wider audience.
D3.js
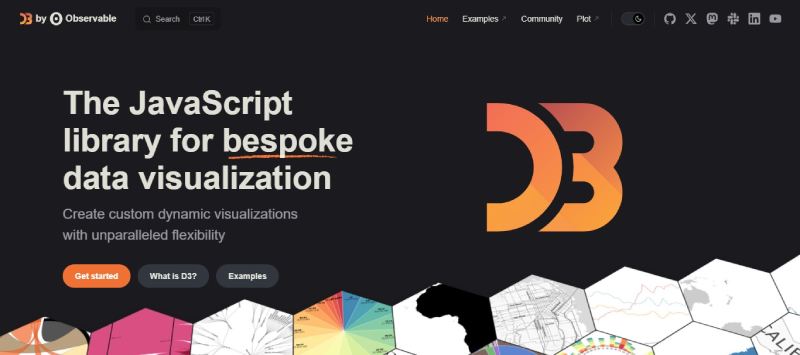
D3.js maps the domain of data visualization with masterful precision. Its canvas is the web browser; its brush is JavaScript, wielded with power and dexterity. Crafting interactive, high-fidelity charts, D3.js stands tall as the library of choice for artisans of data visualization.
Best Features
- Detailed control for customization
- Large community and ecosystem
- Dynamic, interactive visualizations
What we like about it:
For sculpting the narrative of data with artisanal detail, D3.js’s unparalleled degree of customization earns its acclaim and popularity.
ApexCharts
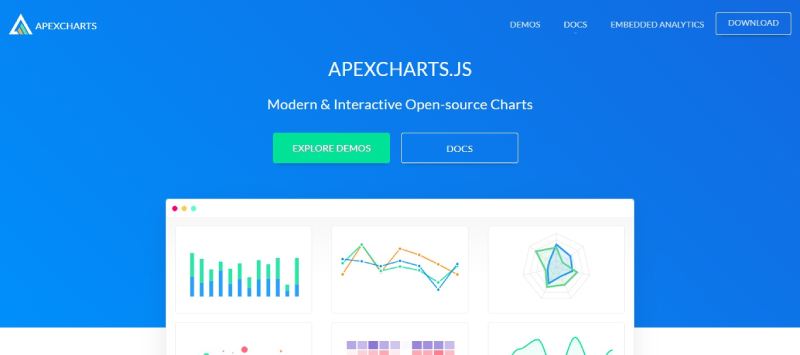
ApexCharts forges paths through the thicket of complexity to deliver sleek, modern charts with a focus on the gentle curve of user experience. This library is a beacon for those in search of combining performance with a dash of sophistication.
Best Features
- Modern chart types
- Easy to integrate
- Rich interactivity
What we like about it:
ApexCharts bridges simplicity with functionality, arming developers with the tools to create contemporary charts with brisk utility and visual appeal.
Chartist

Chartist sings the siren song of simplicity. As a responsive charting library, its offerings peak with its ability to adapt to an array of screens, enchanting with a promise of straightforward integration and a focus on core chart types.
Best Features
- Responsive design
- Simple API
- Lightweight and fast
What we like about it:
Chartist captivates with its uncomplicated, singular focus on crafting efficient, responsive charts, positioning it as a minimalist choice in the wide ocean of charting alternatives.
CanvasJS
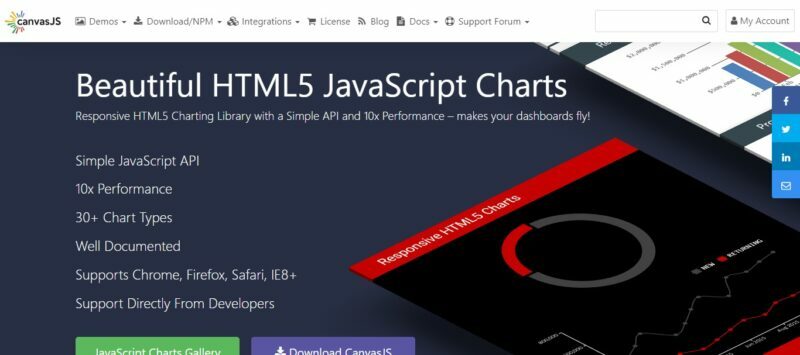
CanvasJS is a titan in the performance arena. It shores up the pillars of scalability and speed with Canvas-based charts that refuse to sacrifice beauty for briskness, underpinning projects that demand both speed and a polished finish.
Best Features
- High-performance charts
- A wide range of chart options
- User-friendly interface
What we like about it:
What entices most is CanvasJS’s agility; a herald of performance without the cumbersome weight, guiding vast datasets into neatly organized, swift visuals.
ZingChart
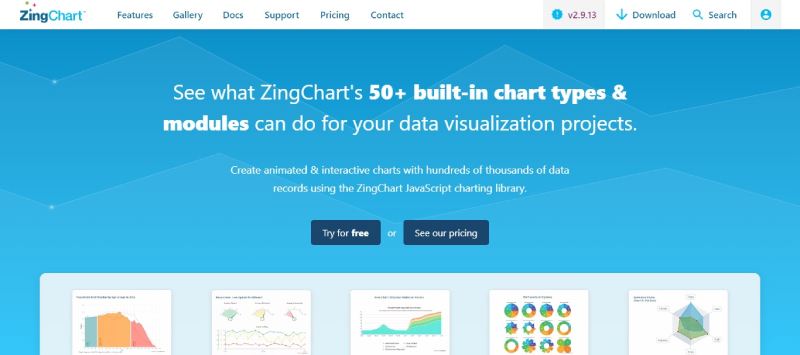
ZingChart maps the peaks of interactive data visualization landscapes, buttressing detailed charting demands with a sturdy, feature-rich framework. Dig into a treasure trove of chart types, confidently showcasing massive datasets.
Best Features
- Abundant chart options
- Interactive features like zooming and panning
- Real-time data support
What we like about it:
The zest with which ZingChart handles interactivity places it at the forefront for those seeking to engage and inform users simultaneously with their data stories.
Dygraphs
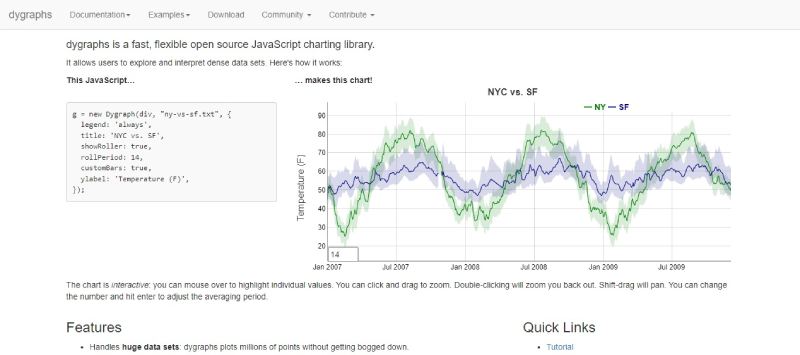
Dygraphs stands as a bastion for those beset by the rigors of large, sprawling datasets. It champions the cause of heavy-duty analysis, allowing a seamless dive into the data depths with pan-and-zoom capabilities that keep clarity afloat without sinking under performance pressure.
Best Features
- Handles large datasets with ease
- Interactive zooming and panning
- Customizable and extensible
What we like about it:
Dygraphs shines brightest in the charting galaxy when the stars of massive data and a need for detailed exploration align.
amCharts
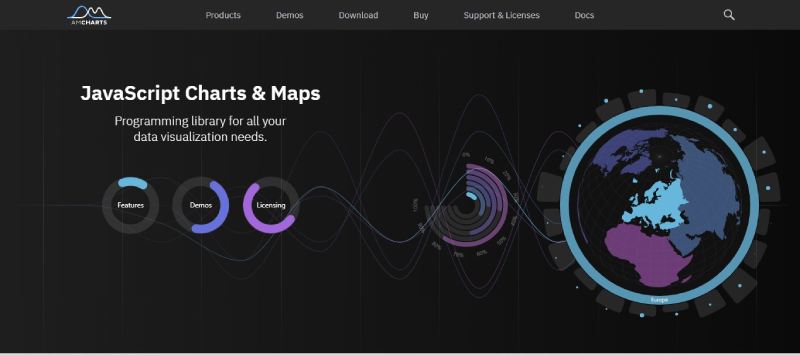
amCharts emerges as the swiss army knife of JavaScript charting libraries, outfitting designers with a multifaceted toolkit. Its rich repository of dynamically updating charts speaks to those who craft data-driven odysseys, marrying precision with massive flexibility.
Best Features
- Wide variety of chart types
- Dynamic data updates
- Exporting options
What we like about it:
The library’s export options stand out, granting users the freedom to transport their visual insights across platforms and presentations with ease.
Google Chars
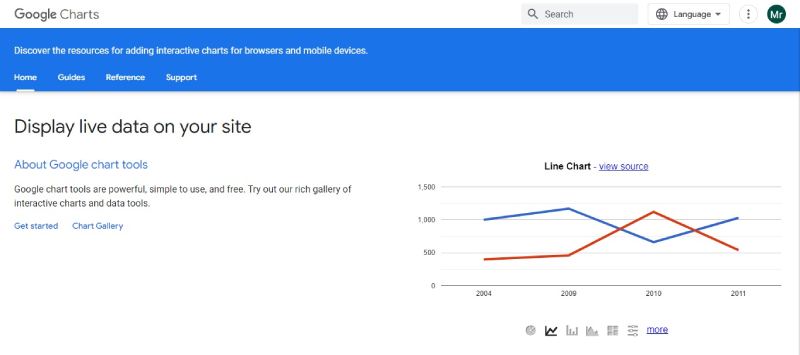
Google Charts issues a clarion call through the halls of accessible, powerful charting tools. Holding the banner high for cross-browser compatibility and ease of use, its extensive chart gallery is a boon for those seeking Google’s hallmark of quality.
Best Features
- Cross-browser compatibility
- Integration with Google products
- Rich charting capabilities
What we like about it:
Its prowess in integrating seamlessly with other Google products carves a niche for Google Charts as a natural ally in the Google-centric workflows.
Billboard
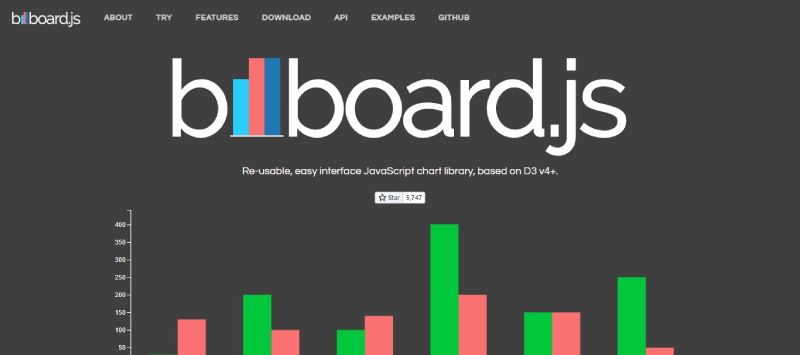
Billboard is a harmonious melody echoing the strengths of D3.js with an overlay of user-friendly abstraction. It presents a simplified approach to the D3.js framework, offering a smoother ascent into the realms of JS charting for those less familiar with D3.js intricacies.
Best Features
- Simplified D3.js usage
- Good abstraction layer
- Customizable and open-source
What we like about it:
Its bridge-building between ease and power grants Billboard a niche where simplified access to D3.js strength is the guiding star.
ECharts
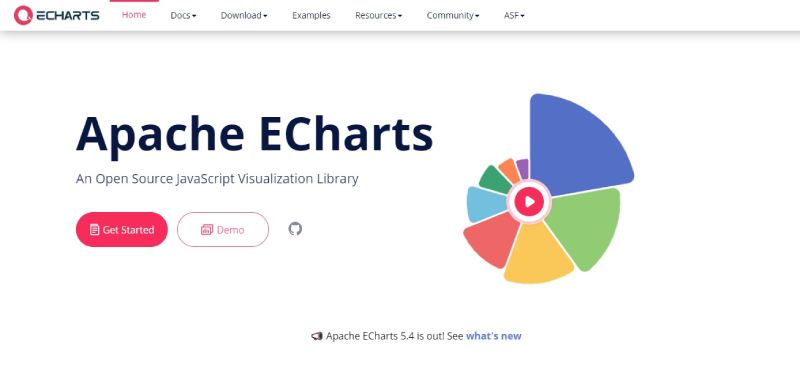
ECharts sketches out a cartography of interactivity and rich features, where the longitude and latitude of charting possibilities stretch to the horizon. It’s an offering by the tech giants at Baidu, promising to make the data dance with boundless grace and flexibility.
Best Features
- Rich interactive features
- Strong international support
- Comprehensive chart types
What we like about it:
ECharts commands attention with its competency in interactive storytelling, where every point on the chart is an invitation to explore further.
C3
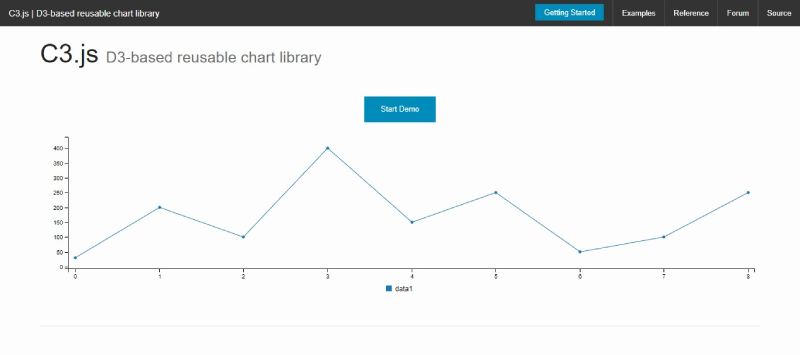
C3 strings together the finesse of D3.js with a more approachable chain of command. It’s the charting knight in shining armor for those seeking to wield the D3.js sword sans the complexity, rendering crisp visuals with minimal configuration.
Best Features
- Easy to use D3.js abstraction
- Responsive and customizable
- Detailed API documentation
What we like about it:
The C3 library streamlines the path to beautiful, D3-powered charts without demanding steep mastery, ensuring a quick start for data visualization quests.
Nvd3
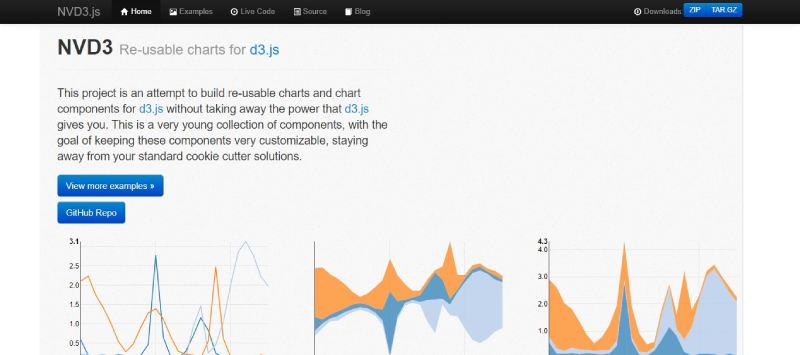
Nvd3 builds on the shoulders of D3.js, stretching its capabilities through a streamlined API that promotes reusable chart components. It’s a rallying cry for developers who want D3.js’s potential without getting tangled in its vast API.
Best Features
- Reusable chart components
- Simplified D3 integration
- Interactive visualizations
What we like about it:
Nvd3’s commitment to reusability and simplification emerges as its tour de force, edging out complexity for swiftly erected, elegant data stories.
FAQ On JavaScript Charting Libraries
What is a JavaScript Charting Library?
A JavaScript Charting Library is essentially a collection of code that enables web developers to easily create a wide variety of charts for web applications. These libraries tap into JavaScript’s powerful capabilities to manipulate data and present it visually, often with simple yet flexible APIs.
Why Use JavaScript Charting Libraries?
In the realm of web design, data storytelling is paramount. JavaScript charting libraries empower creators to encapsulate vast data into digestible visual narratives, enhancing the user experience. They are pivotal in crafting interfaces that not merely display data but engage and inform viewers dynamically.
How Do JavaScript Charting Libraries Work?
At their core, these libraries intuitively translate data points into graphical representations. Leveraging the DOM, they use SVG or Canvas elements to draw charts in the browser, where details from aesthetics to real-time updates can be finely tuned.
Which JavaScript Charting Library Should I Choose?
The selection hinges on your project’s requirements: Chart.js shines for simplicity and ease of use, while D3.js offers unrivaled power and flexibility. Highcharts excels in interactivity, and Plotly is a go-to for data scientists craving rich, analytical displays.
Can I Use JavaScript Charting Libraries for Commercial Projects?
Most charting libraries come with dual licensing. Libraries like Chart.js are open-source under the MIT license, inviting use in commercial projects. Nonetheless, always review the specific license attached to your chosen library to ensure compliance.
How Customizable Are JavaScript Charting Libraries?
From color schemes to interactive elements, the customization is broad and varied. Frameworks like D3.js are particularly renowned for their vast flexibility, enabling designers to modify virtually every element of their charts, tailoring to the last pixel.
Are JavaScript Charting Libraries Compatible with Mobile Devices?
Yes, many libraries are built with responsive design in mind. For instance, Chart.js and Highcharts automatically adjust the chart layout to fit various screen sizes, ensuring a smooth user experience across desktop and mobile devices.
How Do JavaScript Charting Libraries Handle Large Datasets?
Efficiency is key with extensive datasets. Some libraries, like D3.js and CanvasJS, excel in performance, utilizing efficient DOM manipulation techniques and rendering to ably handle large volumes of data without compromising on rendering speed.
What Are Some Challenges of Using JavaScript Charting Libraries?
The learning curve can be steep, especially with libraries that offer extensive customization like D3.js. Cross-browser compatibility issues may also arise, necessitating thorough testing. Additionally, performance optimization becomes crucial as the complexity of data visualization increases.
How Do I Integrate a JavaScript Charting Library with My Existing Web Application?
Integration typically involves importing the library into your project and invoking its API to draw the charts. This process meshes with your application’s data processing flow, where you map data points to the charting functions provided by the library, such as with APIs from Plotly or ApexCharts.
Conclusion
Navigating the vast ocean of data with mere numbers and text is an odyssey of the past. JavaScript charting libraries have revolutionized the way we perceive and engage with information. They have become the lighthouses guiding us through the stormy seas of data interpretation.
With a journey through the landscapes of Chart.js and the peaks and valleys of D3.js, we’ve seen that the ability to craft insightful and interactive graphs is palpable. Whether it’s wielding the tools of data visualization to produce dynamic charting interfaces or using the precision of SVG charting solutions for high-quality visuals, the power is now at our fingertips.
Embrace these robust capabilities. Let the fusion of creativity and data guide every stroke of design on the digital canvas. The stories data can tell through these ingenious libraries are only limited by imagination. As the curtain falls on this exploration, one thing remains crystal-clear – charting a path through the world of data has never been more accessible, or more beautiful.
If you liked this article about JavaScript charting libraries, you should check out these articles also:
- Cash Advance Apps That Work With Chime
- Apps Like MoneyLion: Alternatives To Use
- Apps Like SoLo Funds At Your Fingertips
With over a decade in the tech field, Bogdan blends technical expertise with insights on business innovation in technology.
A regular contributor to TMS Outsource's blog, where you'll find sharp analyses on software development, tech business strategies, and global tech dynamics.
- Streamline Data Access with JavaScript’s for-in Loop - May 19, 2024
- Master Your Build: Essential Java Build Tools - May 19, 2024
- Stay Connected With Messaging and Chat Apps Like Messenger - May 18, 2024