


Ever hit a coding roadblock that turns your screen into a baffling canvas of errors? That’s where the art of troubleshooting comes alive — specifically through powerful JavaScript debugging tools.
These digital scalpels and stethoscopes for code breathe life into the staggering complexity of scripts, offering clarity amidst chaos.
Diving into web development’s intricate landscape, it’s essential to harness tools that not only pinpoint but also dissect issues with surgical precision. By the close of this article, expect to wield an arsenal of JavaScript debugging methodologies, equipping you to elegantly navigate the trickiest of coding conundrums.
Prepare to delve into a suite of instruments — from Chrome DevTools’ rich diagnostic features to the nuanced error tracking capabilities of Node.js. These aren’t mere utilities; they’re the silent partners in crafting stellar web experiences.
Unpack the process of setting breakpoints, inspecting variables, and optimizing performance, transforming the tangled web of JavaScript into an ordered domain of possibility.
| JavaScript Debugging Tools | Supported Platforms/Browsers | Key Features | Integration/Ease of Use | Pricing |
|---|---|---|---|---|
| Breakpoint | Firefox | Part of Firefox DevTools, code stepping, breakpoints, watch expressions | Integrated in Firefox, no additional installation required | Free |
| Firefox JavaScript debugger | Firefox | Built into Firefox, source maps, breakpoints, stack traces | Integrated in Firefox, no additional installation required | Free |
| GlitchTip | Web-based (supports various languages including JavaScript) | Open source error tracking, integrates with GitLab, GitHub, and others | Requires integration with code/projects | Open source (self-hosted); SaaS with free and paid plans |
| Chrome DevTools | Chrome | Profiling, console, network monitoring, device mode | Integrated in Chrome, no additional installation required | Free |
| Rollbar, Inc. | Web-based (supports various platforms) | Real-time error tracking, telemetry, supports source maps | Requires integration with projects. SDKs available | Free tier, paid plans |
| Visual Studio | Windows, macOS (with Visual Studio for Mac) | Full-featured IDE, debugging, profiling, diagnostics tools | Standalone application, fairly complex setup | Free Community version; Paid Pro and Enterprise versions |
| Airbrake | Web-based (supports multiple languages) | Error monitoring, performance insights, deploy tracking | Requires integration with projects | Paid plans only |
| Edge Developer Tools | Edge | Profiling, debugging, device emulation | Integrated in Microsoft Edge, no additional installation required | Free |
| Postman | Windows, macOS, Linux, Web | API development and testing, debugging, monitoring | Standalone and Web application | Free tier, Paid plans |
| Raygun | Web-based (supports various platforms) | Error and performance monitoring, user tracking, deployment tracking | Requires integration with code/projects | Paid plans only |
| JS Bin | Web-based | Collaborative web development, live output, support for JavaScript/HTML/CSS | Web application | Free tier, Paid Pro version |
| ESLint | Web-based, CLI | Linting utility, identifies and reports on patterns in JavaScript | Requires integration into build process | Open source (Free) |
| Firebug | Discontinued (was for Firefox) | Integrated with Firefox, editing, debugging, monitoring (now replaced by Firefox DevTools) | Was integrated in Firefox | Discontinued |
| Sentry | Web-based (supports various languages) | Error tracking, release integration, performance monitoring | Requires integration with code/projects | Free tier, Paid plans |
JavaScript Debugging Tools
Breakpoint
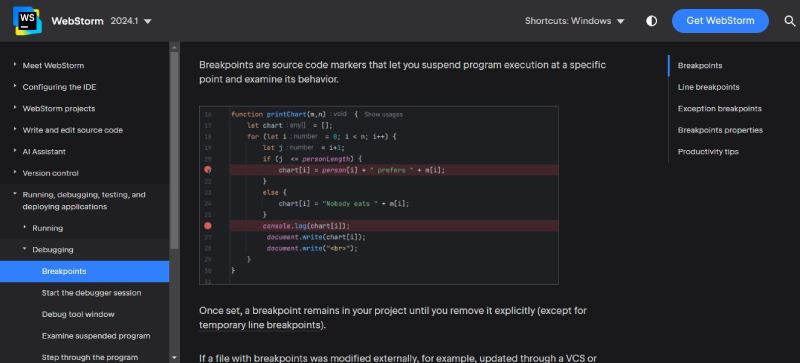
Breakpoint, in the realm of JavaScript debugging tools, is where clarity meets code. It’s the invisible flag that brings the chaos of execution to a still, allowing for meticulous inspection of application state. It’s integral to a developer’s toolkit, a linchpin in understanding the intricate dance of logic across the JavaScript landscape.
Best Features:
- Precise line targeting
- Conditional expressions
- Hit count control
What we like about it: The fine-grained control over run-time execution as Breakpoint illuminates the path through the thicket of code, making it a bedrock feature in debugging sessions.
Firefox JavaScript Debugger
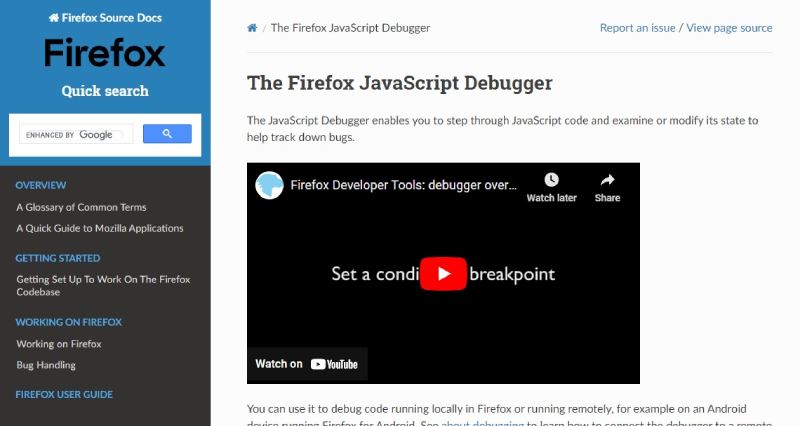
Firefox JavaScript Debugger emerges as a beacon of hope for developers navigating the labyrinthine world of code. Part of the Firefox Developer Tools, it offers a polished, user-centric interface that makes dissecting and triaging code feel like a guided tour through the matrix of your scripts.
Best Features:
- Seamless step-through debugging
- Live expression watching
- Source map support
What we like about it: Its integration with Firefox and the watch expressions feature ensure no variable goes unchecked, no scope goes unexamined.
GlitchTip

GlitchTip casts a wide net, capturing errors before they snag the user experience. Embracing the open-source ethos, it serves as both a beacon and a shield in the tumultuous seas of web development, providing straightforward error tracking with a clean, accessible interface.
Best Features:
- Open-source option
- User privacy focused
- Simplified issue tracking
What we like about it: Its commitment to user privacy and open-source accessibility make GlitchTip a trailblazer for ethical debugging.
Chrome DevTools
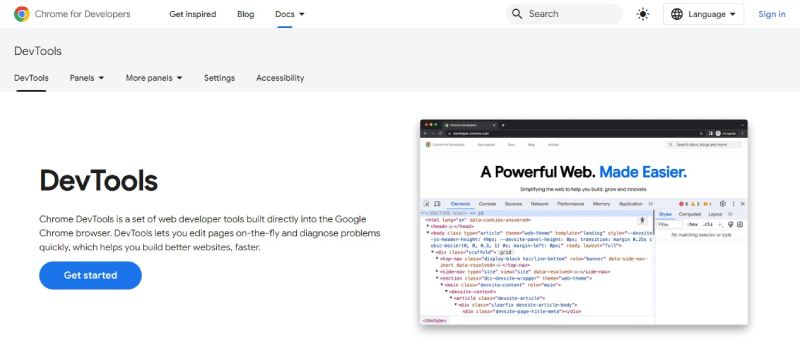
Chrome DevTools stands out as if it were the Swiss Army knife in a digital craftsman’s belt. A cornerstone among browser developer tools, its array of functionalities blend seamlessly into the Chrome browser, allowing developers to unravel, test, and optimize web applications with surgical precision.
Best Features:
- Real-time DOM manipulation
- Network performance insights
- Mobile device emulation
What we like about it: The depth and breadth of tools available, especially the Network performance testing abilities, stand out, ensuring no stone is left unturned in the pursuit of web perfection.
Rollbar, Inc.
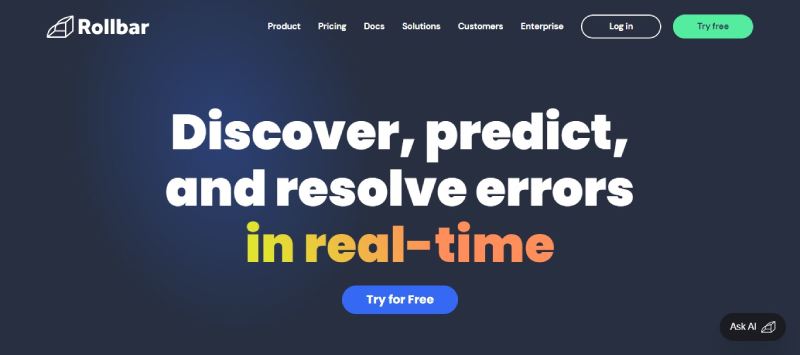
In the sweep of error resolution, Rollbar shines as a torch in the void. Creating visibility across the entire error lifecycle, it integrates effortlessly into the software development lifecycle (SDLC), transitioning from an instrument to an extension of the developer’s own faculties.
Best Features:
- Real-time error monitoring
- Team collaboration
- Intelligent grouping and analysis
What we like about it: It’s the real-time error monitoring; as live as it gets, parsing the streams of data for the developer’s keen eye.
Visual Studio
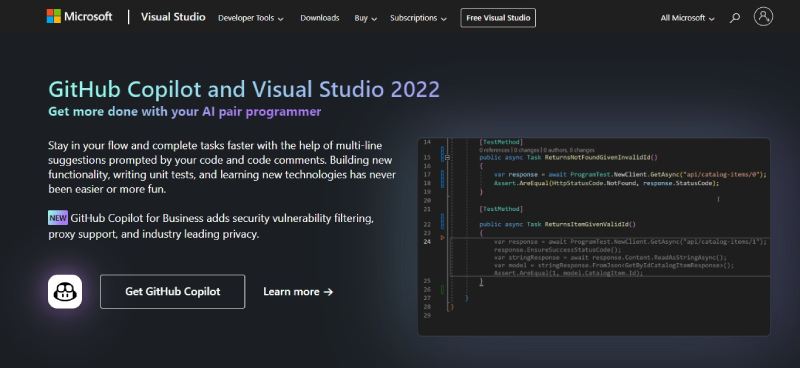
Amid the hustle of code and craft, Visual Studio stands tall as a fortified tower. More than an IDE, it’s a companion for any developer, providing robust features like integrated debugging that delve into the very DNA of an application.
Best Features:
- Comprehensive debugging suite
- Integrated version control
- Extensive language support
What we like about it: The debugging suite’s integrated version control is a marvel, ensuring that each line of code remains both scrutinized and sanctified.
Airbrake
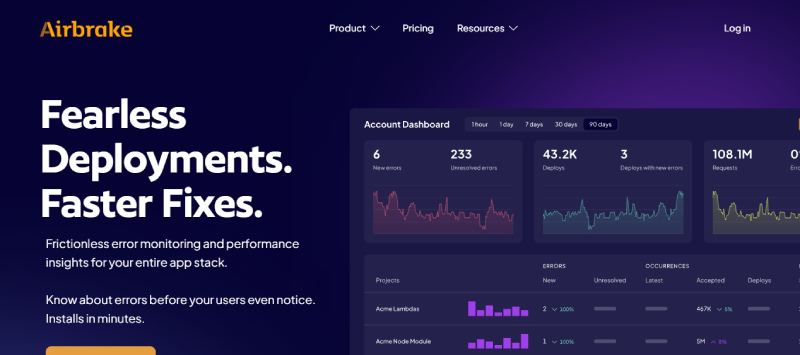
Airbrake is not just a tool; it’s a silent sentinel, ever-watchful for the nemesis of developers everywhere: uncaught errors and performance issues. Its approach to error monitoring and handling invites a calmer rhythm to the ordinarily frenetic debugging workflow.
Best Features:
- Error grouping and aggregation
- Performance monitoring
- Deploy tracking
What we like about it: Performance monitoring is the standout feature, turning reams of potential problems into actionable insights.
Edge Developer Tools
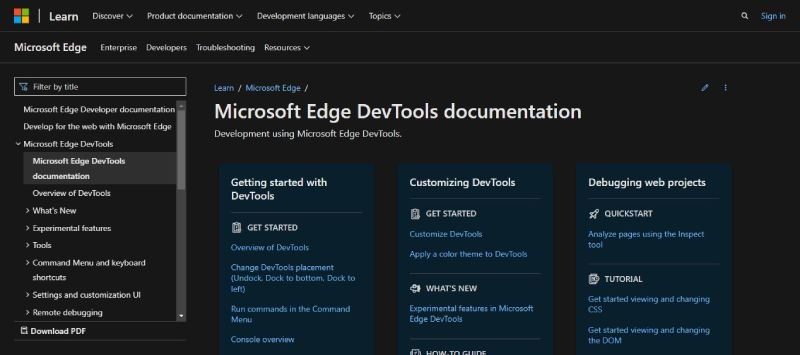
For those who forge digital experiences, Edge Developer Tools is akin to a master key. Tucked within the Edge browser, it unfurls a tapestry of options for interactive debugging, making it a stalwart ally in the developer’s day-to-day conquests.
Best Features:
- Edge-specific optimizations
- Compatibility testing tools
- Network inspection
What we like about it: With tools tailored for the Edge experience, it’s the compatibility testing tools that developers laud, weaving the thread of seamless user engagement.
Postman
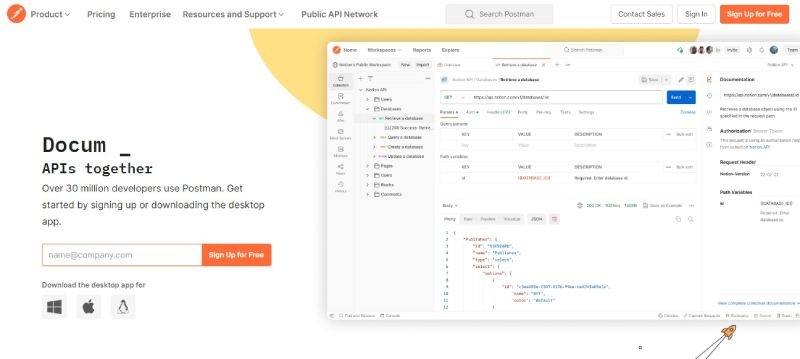
Striding through the terrain of APIs, Postman commands attention. It goes beyond mere testing frameworks and morphs into an environment unto itself, one where APIs are not just tested but understood, not just used but mastered.
Best Features:
- API design and mock
- Automated testing
- Documentation generation
What we like about it: The interactive API testing is a crowd favorite, particularly for how it elevates the debugging AJAX calls to an art form in its own right.
Raygun
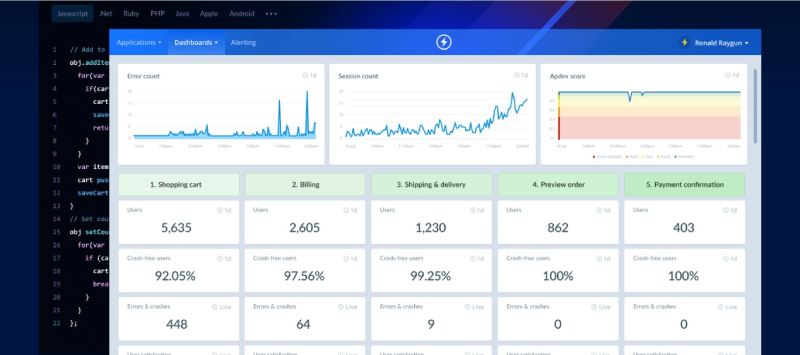
One does not simply monitor errors; with Raygun, one commands them. This tool tactfully assembles a mosaic from the shards of broken application states, providing clarity and foresight into the health of a digital ecosystem.
Best Features:
- Error diagnostics
- User journey tracking
- Real user monitoring (RUM)
What we like about it: The real user monitoring shines, offering a panorama of the user’s experience, transforming user interface debugging into narrative form.
JS Bin
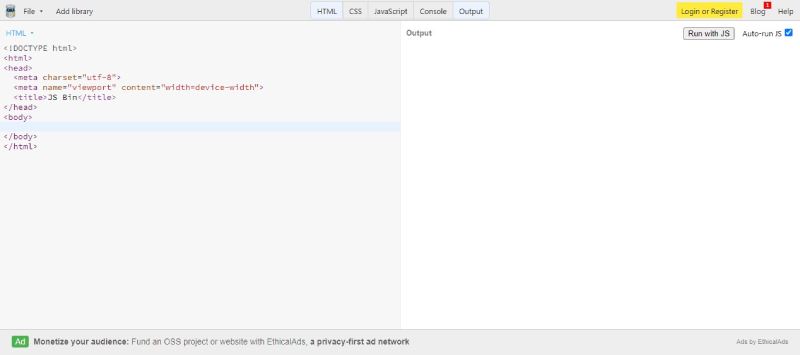
Imagine a sandbox where code roams free, yet under a watchful gaze; that’s what JS Bin offers. It’s a haven for experimentation, a place where script source mapping meets spontaneous creativity, without the fear of breaking the mold.
Best Features:
- Live output
- Collaborative editing
- HTML, CSS, and JS integration
What we like about it: The collaborative editing feature captivates, turning solitary code-crafting into a symphony of collective genius.
ESLint
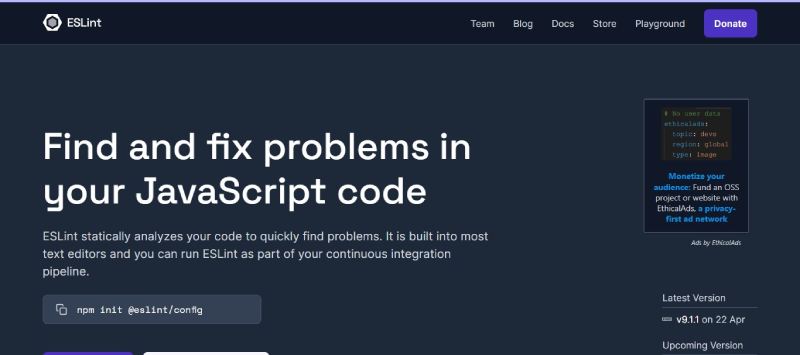
In the orchestra of code, ESLint is the conductor’s baton, guiding the rhythm and ensuring the ensemble plays in harmony. Serving as an indispensable tool for JavaScript linting, it fosters a culture where even the smallest of errors faces scrutiny.
Best Features:
- Custom rule configuration
- Plugin extensibility
- Automatic code fixing
What we like about it: It’s the automatic code fixing that patches up syntax and enforces stylistic conventions with an unobtrusive touch.
Sentry
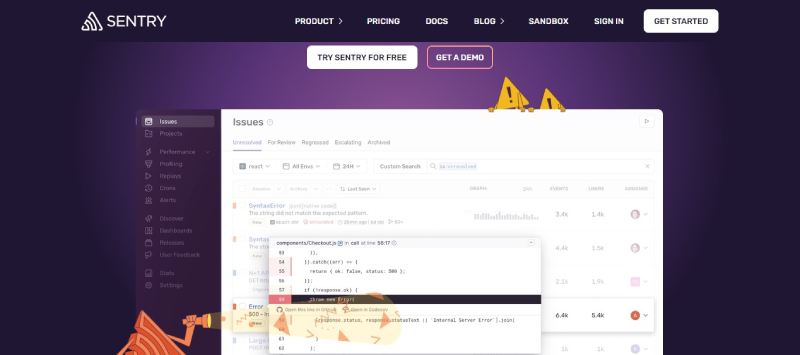
Sentry acts with the stealth and precision of a ninja, keeping watch over applications, silently catching exceptions as they occur. It’s become a linchpin in many developers’ arsenals, offering a rare blend of error logging and performance monitoring with source code breakpoints.
Best Features:
- Multi-language support
- Release and commit tracking
- Customizable alerting
What we like about it: Its release tracking capabilities are lauded, delivering crystal clear insights into the impact of code changes as they journey to production.
FAQ On JavaScript Debugging Tools
What are JavaScript Debugging Tools?
These are the surgeon’s instruments for web developers, where we cut through the code, stitch logic correctly, and eradicate bugs. They range from browser developer tools to JavaScript profilers and error tracking services, specifically designed for diagnosing and fixing issues in JavaScript code.
How Do I Access JavaScript Debugging Tools?
Most modern browsers come equipped with their tools for this exact purpose. Accessing them is as simple as hitting F12 or right-clicking a webpage and selecting ‘Inspect’. Using Chrome DevTools or Firefox Debugger, an entire dashboard of debugging options reveals itself.
Can JavaScript Debugging Tools Handle Asynchronous Code?
Absolutely, this is where they shine. The chaos of callbacks and promises becomes manageable. Tools provide ways to set breakpoints in asynchronous code, making sure you catch the right state in the event loop and can step through the logical flow of the code.
What’s the Advantage of Using Source Code Breakpoints?
Imagine having a pause button for your code; that’s what source code breakpoints do.
They halt execution precisely where issues may lurk, letting you verify the current state, the call stack, and surrounding variables without disturbing the overall code environment—crucial for isolating and squashing elusive bugs.
Are These Tools Only Useful for JavaScript Running in Browsers?
Not at all. Node.js developers can cheer as tools like Node Inspector or integrated options in IDEs empower server-side debugging. Node.js inspection brings the clarity of client-side debugging to server scripts, making tools just as powerful for backend JavaScript.
How Do Debugging Tools Improve Performance Monitoring?
Through detailed JavaScript profilers and network analysis features, developers can reveal performance bottlenecks and memory leaks.
It’s like having a health check-up for your code, identifying which lines are causing slowdowns or consuming too many resources, enabling you to optimize for the best user experience.
How Do They Impact Code Analysis in Real-Time?
They’re like having a live feed into your code’s execution. Real-time code analysis tools offer immediate insight into how your code behaves in action. They allow live editing and immediate results without the need for codebase rebuilds, significantly speeding up debugging and testing cycles.
Can Debugging Tools Aid in Catching Exceptions?
Catching exceptions is their bread and butter. You set conditions—watchdog alerts of sorts—that notify and halt execution when an error is thrown. Exception handling becomes proactive, giving you a roadmap to the exact line of trouble and the error message to decipher what went wrong.
How Do They Assist in Web Application Diagnostics?
They are the triage for web crises. Debugging tools dissect your live applications, unveiling issues with the DOM, AJAX calls, and JavaScript event listeners.
They grant you x-ray vision into your application’s operational aspects, from page load times to API requests, elevating diagnostics to a fine art.
What’s the Learning Curve Like for These Tools?
Initially, it’s like learning a new dialect of your native language. There are nuances to master.
But spend time with debugging workflow, and the quirks become second nature, giving you deeper insight into how browsers interpret JavaScript. Your fluency in debugging will grow, turning complicated problems into systematic checks and fixes.
Conclusion
Embarking on a journey through the intricate pathways of code, it becomes apparent the role of JavaScript debugging tools is irreplaceable. They stand as guardians against the tide of errors that can overwhelm even seasoned artisans of web craft. Wielding them turns a daunting expedition into a controlled, even enjoyable one.
- A well-oiled debugging workflow
- The uncanny ability to set breakpoints with clinical precision
- Insightful performance monitoring
Each has proven indispensable, transforming the enigmatic into the understandable. What’s revealed is more than just a sequence of syntactic symbols; it’s an interconnected matrix where logic, creativity, and structure converge seamlessly.
In the finale of this exploration, equipped with new knowledge on such potent instruments, one can anticipate a metamorphosis in how obstacles are approached — no longer as barriers but as puzzles awaiting solutions. From Chrome DevTools to the Node.js inspection, mastering such tools marks a rite of passage; the transformation from mere coder to digital sculptor of the modern web realm is complete.
If you liked this article about JavaScript debugging tools, you should check out these articles also:
- Fast Deliveries Anytime: Apps Like GoPuff
- Exploring Uses: What is Java Used For in Modern Tech?
- Organize Your Life: Productivity Apps Like Trello
With over a decade in the tech field, Bogdan blends technical expertise with insights on business innovation in technology.
A regular contributor to TMS Outsource's blog, where you'll find sharp analyses on software development, tech business strategies, and global tech dynamics.
- SEO for Web Developers: Essential Strategies for 2024 - July 2, 2024
- Adding Elements Efficiently: Javascript Array.push() Method - July 2, 2024
- The Role of AI in IT Outsourcing - July 2, 2024