

Imagine diving into the vibrant ecosystem of Java, only to find yourself navigating through thickets of slow runtimes and cumbersome application lag.
The heart of the issue often pulses within overlooked performance metrics and unseen bottlenecks. Herein lies the unheralded hero: Java performance monitoring tools.
Within this digital landscape, ensuring that Java applications run at peak efficiency is not just an option, it’s a categorical imperative.
The crux of maintaining seamless functionality isn’t merely about wielding sophisticated tools; it’s about grasping the nuanced symphony of Java application server monitoring, deciphering the barrages of garbage collection logs, and tuning into the real-time Java monitoring that underlies thriving app ecosystems.
In this deep dive, anticipate uncovering how JVM profiling and garbage collection analysis elevate your Java code to its optimal state. We’ll unravel the threads of Java application scalability testing while keeping a pulse on Java thread diagnostics.
Step into a realm where memory leak detection and Java exception tracking become second nature. Through this article, you will emerge equipped with not just tools but strategies to harness the true power in Java performance tuning.
Java Performance Monitoring Tools
| Java Performance Monitoring Tools | Monitoring Capabilities | Platform Support | Visualization & Reporting | Ease of Use | Pricing |
|---|---|---|---|---|---|
| Glowroot | Application performance metrics | Standalone Java applications | Customizable dashboards | User-friendly | Open source |
| ManageEngine OpManager | Network performance, server monitoring | Windows, Linux, and web-based | Graphical views, Reports | Intuitive interface | Paid, Free trial |
| JProfiler | CPU, memory, threads, and data monitoring | Desktop application | Rich visual feedback | Moderate learning curve | Paid, Free trial |
| SolarWinds | Network, system, database monitoring | Multi-platform support | Interactive charts | User-friendly | Paid, Free trial |
| NetBeans | Code profiling | Integrated development environment | Built-in tools | Straightforward for developers | Open source |
| Pinpoint | Application performance management | Server-based monitoring | Real-time monitoring | Requires setup expertise | Open source |
| Stackify | APM, errors, logs | Cloud-based platform | Real-time insights | User-friendly | Paid, Free trial |
| Apache Tomcat | Web application performance | Java Servlet container | Basic, via third-party tools | Developer-oriented | Open source |
| Datadog | Real-time performance monitoring | Multi-platform support | Comprehensive dashboards | User-friendly | Paid, Free tier |
| Sematext | Logs, metrics, and APM | Cloud-based monitoring | Customizable dashboards | Easy to integrate | Paid, Free tier |
| New Relic | Application performance management | Multi-platform support | Deep data insights | Moderate learning curve | Paid, Free tier |
| JavaMelody | Performance and traffic metrics | Servlet containers, Java EE applications | Simple charts | Straightforward | Open source |
| VisualVM | CPU, memory, and thread profiling | Standalone Java applications | GUI-based | Moderate to easy | Open source |
| Stagemonitor | Application performance in production | JVM-based applications | Kibana dashboards | Developer-oriented | Open source |
| Dynatrace | Full-stack monitoring | Multi-platform support | AI-assisted analysis | User-friendly | Paid, Free trial |
| WildFly | Application server performance | Java EE environment | Simple monitoring tools | Developer-centric | Open source |
| Eclipse Memory Analyzer | Heap memory analysis | Java applications | Detailed heap analysis | User-oriented for developers | Open source |
| Zoho Corporation | Diverse IT management software | Multi-product company (including Site24x7 for monitoring) | Depends on product | User-friendly | Paid, Free trial |
| Pingdom | Uptime, page speed monitoring | Cloud-based monitoring | Interactive reports | User-friendly | Paid, Free tier |
| JRebel | Code change visibility | Java applications | Lightweight integration | Easy to use for developers | Paid, Free trial |
| Scouter | Real-time monitoring | Java applications | Web-based interface | Moderate learning curve | Open source |
| AppDynamics | Business transactions and application performance | Multi-platform support | Detailed real-time analytics | Immersive, complex setup | Paid, Free trial |
| Java Mission Control | In-depth application diagnostics | Java applications | JMX Console | Technical, for experienced users | Bundled with Oracle JDK |
Glowroot
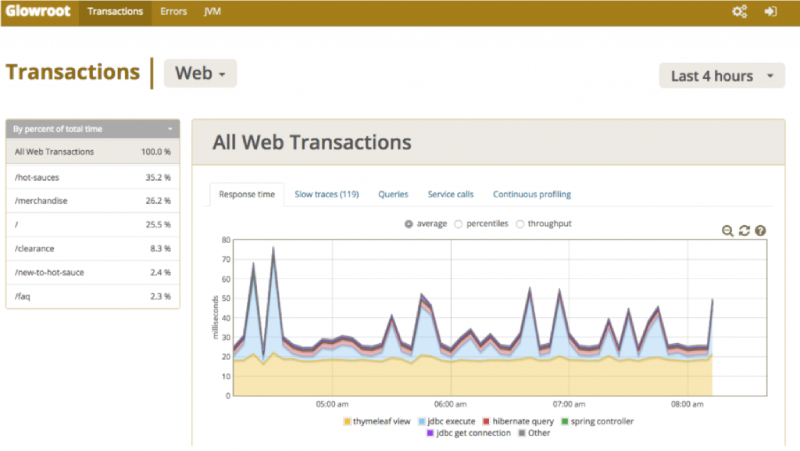

Imagine a lighthouse guiding ships through a fog-covered sea—that’s Glowroot in the realm of Java performance monitoring tools. Its open-source essence ensures transparency in application performance management, illuminating the path to improved Java application responsiveness with minimal fuss.
Best Features
- Real-time query and transaction monitoring
- Low overhead, perfect for production environments
- Detailed transaction traces and error reporting
What we like about it:
Glowroot’s dashboard is a triumph of clarity, providing users with immediate, actionable insights into their Java applications’ behavior with minimal configuration.
ManageEngine OpManager
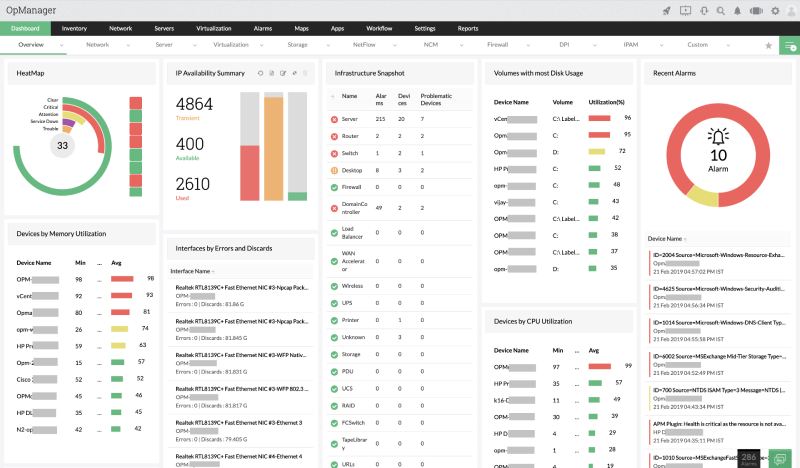

Venturing through digital ecosystems calls for a sherpa like ManageEngine OpManager, a vigilant monitoring solution for large-scale Java infrastructures. It keeps a watchful eye on network performance alongside Java applications, a double arsenal in one comprehensive package.
Best Features
- Network and server monitoring capabilities
- Customizable dashboards and intelligent alerting
- Workflow automation and advanced analytics
What we like about it:
OpManager’s versatility is its crown jewel, not only mastering Java application monitoring but also expertly navigating the nuances of network performance.
JProfiler
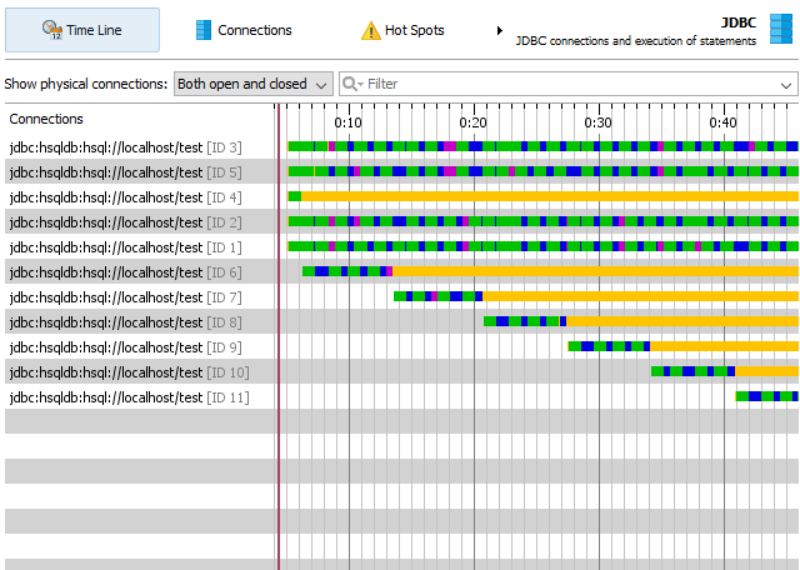

JProfiler stands as the maestro of Java application performance orchestration, brandishing sharp instruments for in-depth analysis. With its high-resolution lenses, find clarity in CPU usage, memory leaks, and threading issues. It’s a choice cut for developers craving surgical precision in Java performance tuning.
Best Features
- Rich profiling capabilities
- Powerful heap walker and memory analysis
- Detailed database and query profiling
What we like about it:
The strength of JProfiler is in its ability to dissect Java performance with a scalpel, revealing intricate details about resource consumption and inefficiencies.
SolarWinds
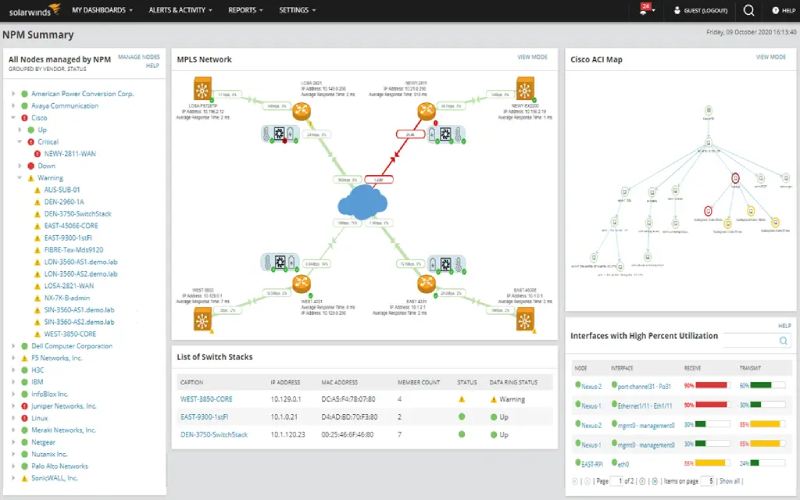

Equate SolarWinds to a digital alchemist, capable of transmuting raw performance data into nuggets of operational gold. This suite of tools gifts users the Midas touch for monitoring Java virtual machine (JVM) performance metrics and ensuring applications don’t crumble under pressure.
Best Features
- Broad IT management toolset, including database monitoring
- Detailed performance analytics
- Robust infrastructure monitoring
What we like about it:
SolarWinds excels at offering a panoramic view of IT health, integrating Java performance monitoring with larger system contexts beautifully.
NetBeans
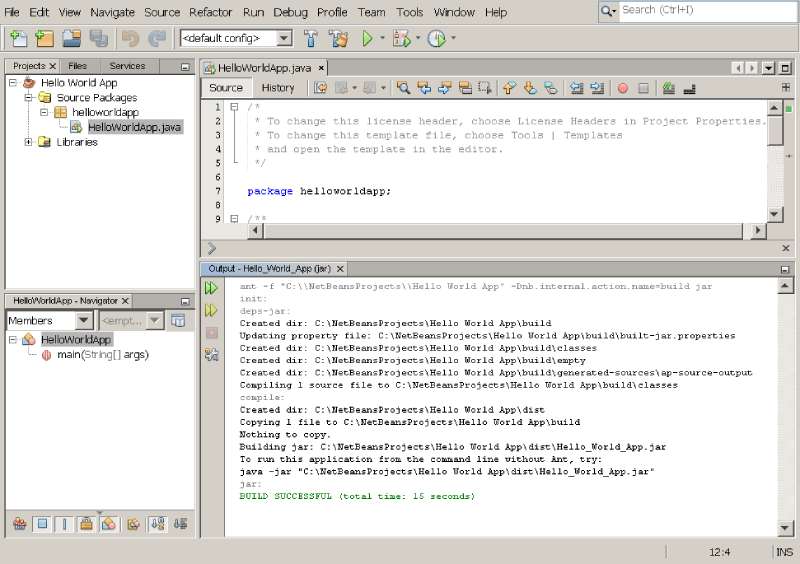

As an integrated development environment, NetBeans offers more than code editing—it has a built-in profiler that’s a reliable companion through the garden of code, pruning away inefficiencies to foster robust Java applications that bloom with performance.
Best Features
- Integrated development and monitoring environment
- Real-time CPU and memory profiling
- Extensive plugin support
What we like about it:
NetBeans’ incorporation of a profiler within the development environment allows for immediate, iterative enhancement right from the forge of creation.
Stackify
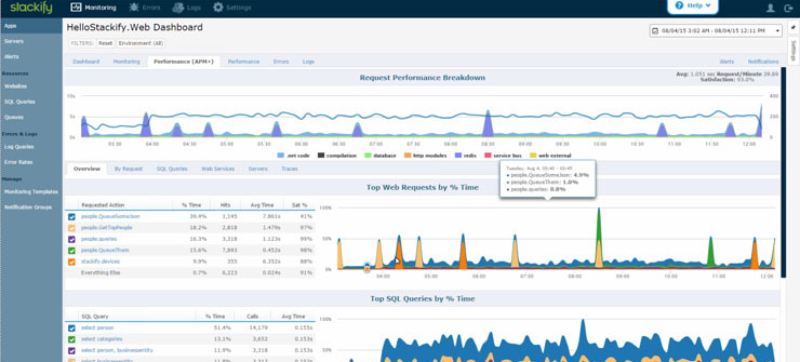

Stackify is a multitasking maestro, intertwining code performance insights with error and log monitoring. Luring developers with its siren song, it comes as an all-in-one platform that not only stays ahead of performance issues but also troubleshoots with precision.
Best Features
- Retrace APM that combines monitoring with logs and errors
- Code-level diagnostics
- Integration with DevOps tools
What we like about it:
The synergy of APM with logging provides a unique cocktail of diagnostics that quickly turns chaos into order.
Apache Tomcat
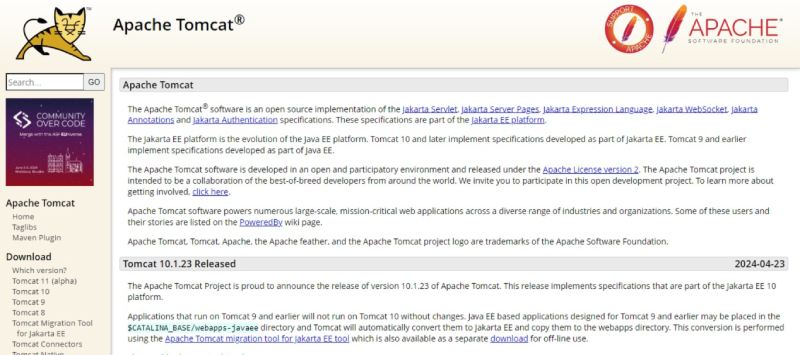

As the trusty steed of Servlet and JSP applications, Apache Tomcat serves more than web content—it brings with it a modest set of monitoring capabilities, tailored for the savvy purveyor of Java-driven websites eager to keep their digital presence in formidable shape.
Best Features
- Lightweight HTTP server with JSP and Servlet support
- Built-in JMX-based monitoring
- Extensive customization through scripting and configuration
What we like about it:
The lean framework endowed with JMX monitoring ensures that nothing goes unnoticed in the realms it lords over.
Sematext
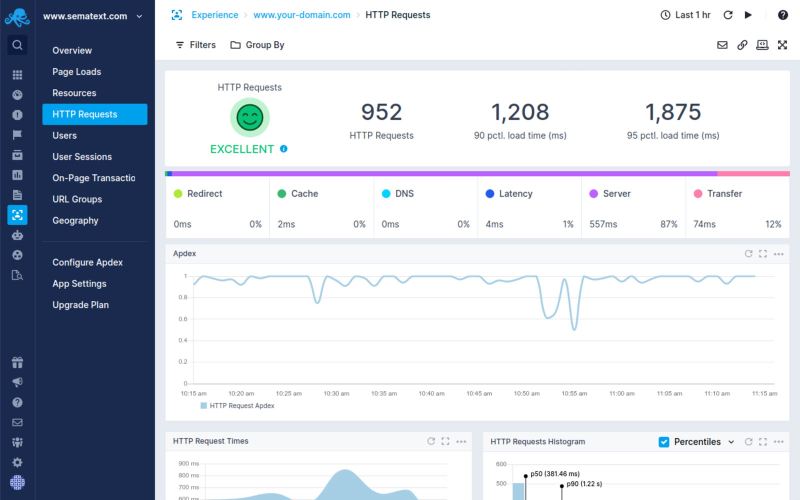
Consider Sematext the cartographer of Java application seas; it charts the ebb and flow of performance tides, laying bare the treasures of operational insights. From Java server performance benchmarking to intricate transaction tracing, it’s a complete atlas for the performance-minded.
Best Features
- Unified logs and metrics
- Full-stack visibility
- Anomaly detection and alerting
What we like about it:
Its unified approach to logs and metrics ensures a holistic view that’s akin to having an all-seeing eye.
New Relic
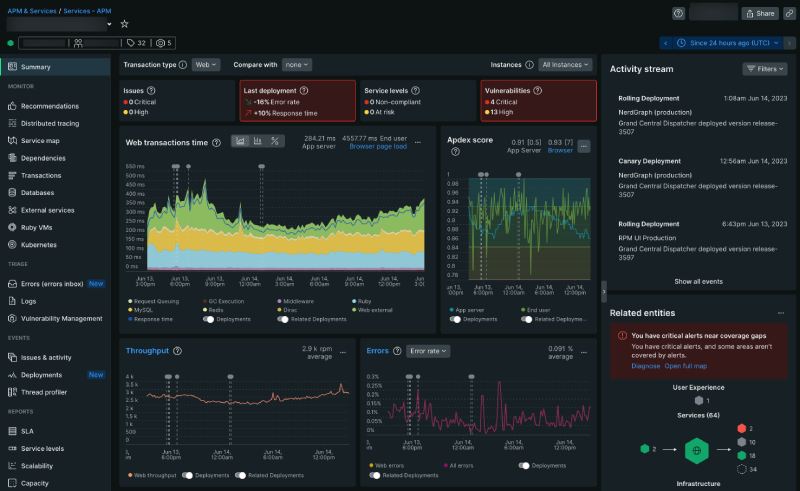

New Relic emerges as a digital soothsayer, prophesizing the state of Java environments through its profound insights. This tool beguiles with its ability to forecast and report performance in real-time, ensuring Java applications are running not just on time, but ahead of it.
Best Features
- Real-time application performance monitoring
- User-centric metrics and end-to-end transaction tracing
- Scalable architecture for high-traffic apps
What we like about it:
The tool’s real-time monitoring and user-centric approach elevate the user experience to celestial heights.
JavaMelody
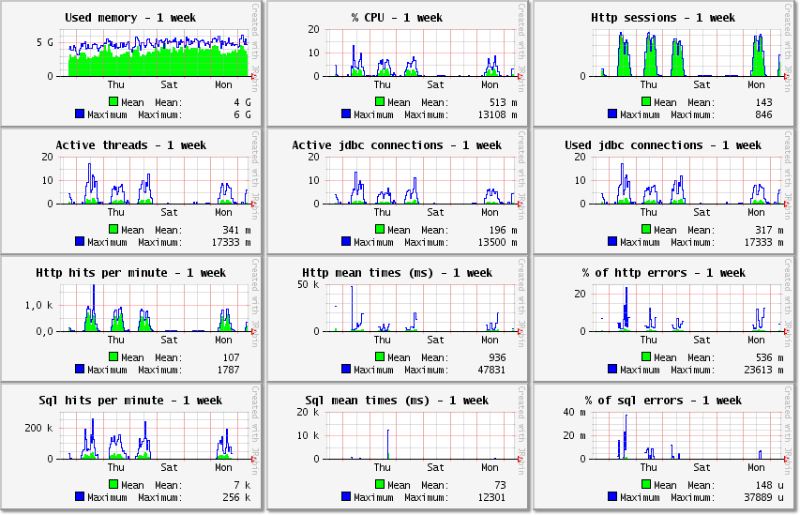

JavaMelody strikes a chord with its minimalist design, yet it sings arias when it comes to detailed Java application performance tuning. It’s the troubadour of resource optimization, serenading developers with sweet melodies of exceptional, straightforward diagnostics.
Best Features
- Simple setup and user-friendly interface
- Comprehensive statistics with graphical representations
- Monitoring of JavaEE applications
What we like about it:
The simplicity of JavaMelody’s setup is the overture to its most enchanting performance—effortless and effective.
VisualVM
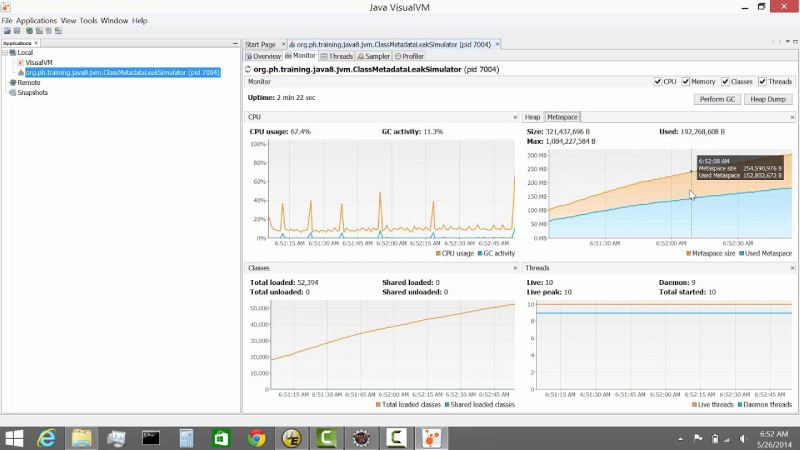

VisualVM is the artisan’s magnifying glass, uncovering the minutiae of Java performance with fine-grained detail. It beckons those who seek a free tool, ready at hand, for profiling, monitoring heap content, and unearthing threads that could unravel the sturdiest of applications.
Best Features
- CPU and memory profiling
- Heap data analysis and thread dump capabilities
- Extensible with plugins
What we like about it:
The balance between nuanced data and zero cost makes VisualVM a masterpiece of utility.
Stagemonitor
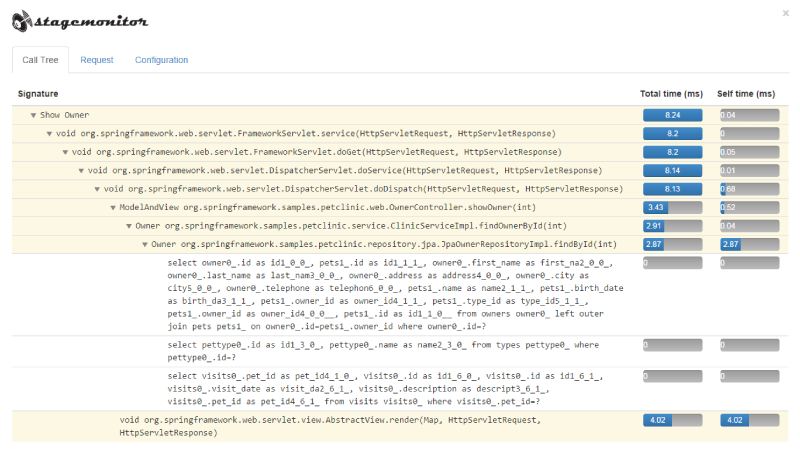

In a realm fraught with complexities, Stagemonitor stands as the steadfast guardian of performance within the Java landscape. It pledges detailed, yet aggressively real-time, monitoring especially tailored for Java web applications domiciled in containerized environments.
Best Features
- Real-time application performance monitoring
- Seamless integration with Kibana and Elasticsearch
- In-depth metrics on JVM health and web transactions
What we like about it:
Its seamless melding with Kibana and Elasticsearch is like the perfect pairing of fine wine with gourmet cuisine.
Dynatrace

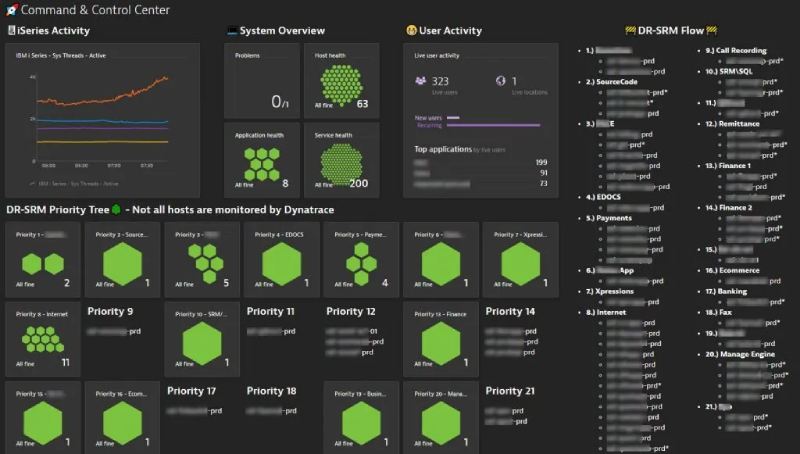
Dynatrace, a titan born of artificial intelligence, observes Java applications with an ever-awake eye. It prides itself on autonomous, full-stack performance insights and preemptive problem resolution, all of which unfurl into an omnipotent command over the digital experience.
Best Features
- AI-powered root cause analysis
- Full-stack visibility from infrastructure to user experience
- Automatic and dynamic baselining
What we like about it:
The AI-driven analytics platform propels it beyond the realms of mere tools into the sphere of clairvoyance.
WildFly
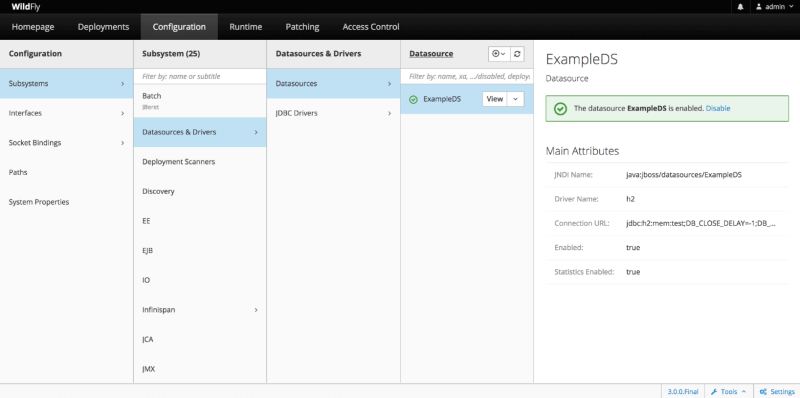

WildFly, formerly known as JBoss AS, dances through the Java ecosystem with an adaptable and lightweight frame. While primarily an application server, its management capabilities extend to performance, blessing you with sub-millisecond latency feats and a robust platform for optimizing enterprise Java.
Best Features
- Lightweight and flexible architecture
- Rich management interface with comprehensive monitoring
- High performance for Java EE applications
What we like about it:
WildFly isn’t just light as a feather—it’s as swift and adaptable, pioneering performances that border on the magical.
Eclipse Memory Analyzer (MAT)
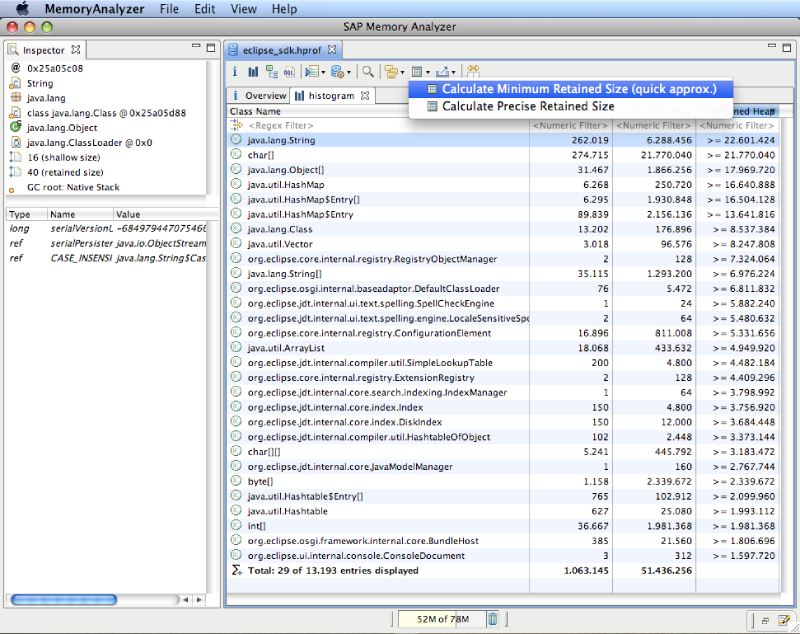

Think of Eclipse Memory Analyzer as a maestro conducting an orchestra of memory resources—it identifies harmonies and dissonances within Java heap space, making it instrumental for unearthing and understanding memory leaks and reducing fat usage.
Best Features
- Advanced heap analysis and leak detection
- Detailed reports on memory consumption
- Plugin architecture for extended functionality
What we like about it:
Its forte truly resounds in the depth of heap analysis—sifting through the clutter to unveil the root causes of bloated memory use.
Zoho Corporation
Zoho Corporation, with its suite of software solutions, includes comprehensive management tools that stealthily track down and smooth out any turbulence in Java application performance. This suite is a bastion of operational serenity, offering a clean interface for professionals who demand a polished command center.
Best Features
- Integrated suite of IT management software
- Real-time monitoring and analytics
- Customizable dashboards and intuitive interface
What we like about it:
The integration of various management tools under a single roof boasts a symphony of convenience and efficiency.
Pingdom
Pingdom is a digital watchguard for uptime and performance. Targeted at web applications, its keen monitoring spells out the health of Java web interfaces, vigilantly patrolling and weighing the performance of every element that loads on your users’ screens.
Best Features
- Website performance and availability monitoring
- Real user monitoring (RUM)
- Detailed reports and alerting system
What we like about it:
Its Real User Monitoring paints an authentic picture of end-user interaction, a narrative that’s crucial for UX-driven performance optimization.
JRebel
JRebel deftly sidesteps the Java development hindrance of constant redeployment. With this potent JVM plugin, developers can bask in the glow of real-time changes, seeing the immediate impact on performance without the dreaded wait of application restarts.
Best Features
- Real-time code and resource updates
- Seamless integration with numerous frameworks and IDEs
- Reduces time wasted on application restarts
What we like about it:
Its most applauded feature is the liberation from redeployment cycles—absolutely transformative for development velocity.
AppDynamics
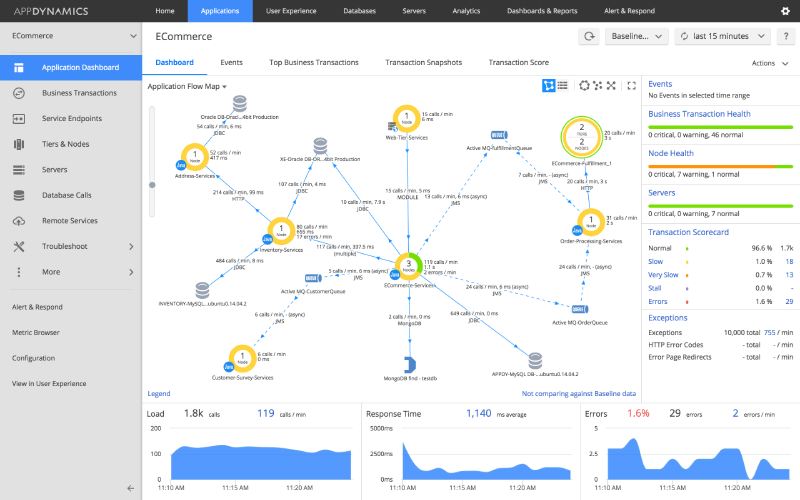
AppDynamics stands as a towering monolith of application intelligence, delving deep into the performance of Java enterprise applications. It unfolds layers of complexity with ease, offering a strategy map that guides through choppy digital waters to the haven of peak performance.
Best Features
- Business transaction monitoring
- Automated application mapping
- Dynamic baselining and anomaly detection
What we like about it:
The business-focused lens through which it views application performance sets a gold standard, translating technical metrics into impactful business insights.
Java Mission Control
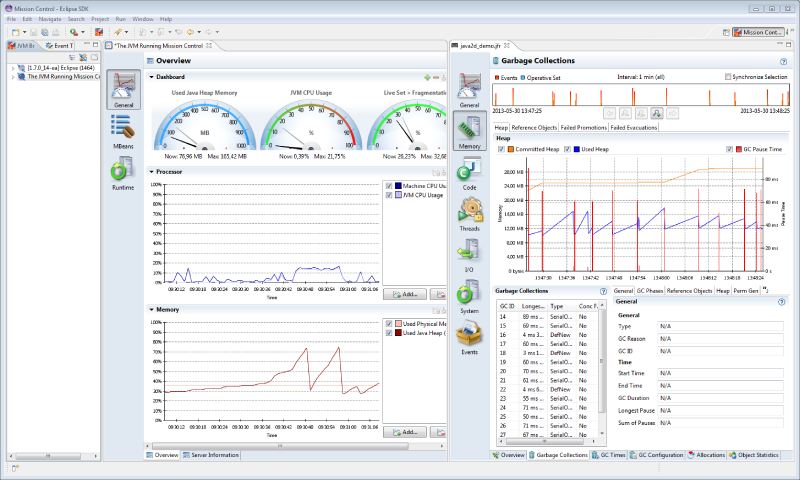

Java Mission Control serves as the cockpit for Java developers, providing a suite of tools designed to manage, monitor, and master the flight of Java application performance. Strap in for a riveting skyward journey that’s overseen with detailed diagnostics and real-time insights.
Best Features
- Integrated with the HotSpot JVM
- Real-time and post-flight analysis tools
- Low overhead for live applications
What we like about it:
The seamless integration with HotSpot JVM and its sophisticated suite of performance analytics tools ensure that no detail is too minuscule.
FAQ On Java Performance Monitoring Tools
What Exactly Does Java Performance Monitoring Entail?
Diving into Java performance monitoring is akin to commanding a submarine through ocean depths, exploring the health of Java applications.
It systematically scrutinizes real-time operation metrics, tuning into CPU usage, memory allocation, and thread activity, untangling potential performance bottlenecks, and maintaining the smooth sailing of Java code.
Why Is Java Performance Tuning Important?
Java performance tuning is the navigator in the vast sea of software. It refines application responsiveness, boosts execution speed, and ensures skyscraper-strong scalability, enabling us to meet user expectations and avoid the treacherous icebergs of system downtime.
Which Tools Are the Best for JVM Profiling?
Choosing the best tool for JVM profiling is like selecting the right lens for a telescope. YourKit, JProfiler, and VisualVM are stellar options, offering granular insight into the JVM cosmos, highlighting memory usage, and casting light on hidden performance issues.
What Are the Best Practices for Using Java Performance Monitoring Tools?
Best practices include sketching a performance baseline as a cartographer charts unknown lands. Deploy continuous Java performance analysis, embrace automated alerts, and regularly review metrics.
It’s a harmonious blend of technical vigilance and strategic response akin to conducting an orchestra of digital processes.
How to Detect Memory Leaks in Java Applications?
Detecting memory leaks in Java is the detective work of software sleuthing. Tools like Eclipse Memory Analyzer and GCViewer are magnifying glasses, revealing clues within heap dumps and garbage collection logs.
They pinpoint leak suspects, allowing you to prosecute offending code and restore law and order.
Can Java Performance Monitoring Improve User Experience?
Absolutely, Java performance monitoring is the artisan of user experience, crafting a seamless interaction with applications.
By sharpening response times and weaving stability into the user’s journey, it not only delights but retains the audience, enhancing their digital tale with every click and scroll.
How Does Garbage Collection Analysis Impact Performance?
Garbage collection analysis is the garden cultivation for Java’s ecosystem. It prevents memory’s garden from overgrowing with wasted objects, which could otherwise choke the productivity of applications.
Proper analysis ensures that vital resources are rejuvenated, promoting a greener, high-performing environment.
What Role Does JVM Heap Analysis Play?
JVM heap analysis is the meticulous bookkeeper in the annals of memory management. It keeps a ledger of memory allocation and consumption, ensuring the heap is not wastefully squandered. It’s about striking a balance, just as a tightrope walker keeps poised above a performance pitfall.
How to Deal With Java Application Scalability Issues?
Confronting scalability issues requires an architectural mindset. It’s about reinforcing the foundation while allowing for skyward expansion.
Using performance monitoring tools, one can stress-test applications, examine system health metrics, and iteratively improve, ensuring the Java building can soar without toppling.
What’s the Value of Distributed Tracing in Java Applications?
Distributed tracing in Java weaves threads into a tapestry of system insight. It maps the journey of requests across service-oriented architectures, demystifying the labyrinth of microservices. This is pivotal in isolating slowdowns and elevating the quest for performance to heroic levels.
Conclusion
Embarked upon this journey through the rich terrain of Java performance monitoring tools, there’s a sense of emerging from a technical chrysalis, enlightened. The expedition has woven through the seams of Java application server monitoring, essentially redefining the golden thread of Java code efficiency.
- Memory leak detection,
- JVM profiling,
- Distributed tracing…
All converge into a collage that articulates, with delicate precision, the artistry behind seamless Java performance. The final brushstrokes of this narrative leave you with an actionable palette:
- Regularly engage garbage collection analysis,
- Integrate continuous Java performance analysis,
- Embrace proactive scalability testing for those moments when digital demand burgeons unexpectedly.
With the newfound knowledge and tools in hand, engineering an optimal environment for Java applications isn’t just a possibility; it’s a tangible next chapter. Knowledge, when applied, transcends the mundane, catalyzing the shift from commonplace to extraordinary performance.
If you liked this article about Java performance monitoring tools, you should check out these articles also:

