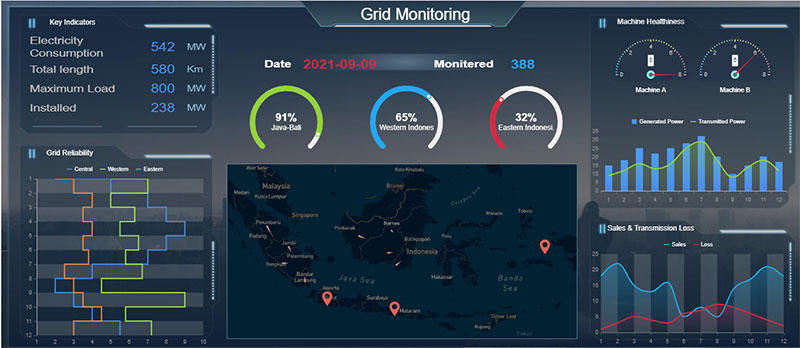
Manufacturing dashboards provide valuable insight into how well production lines are performing. They highlight performance and efficiency metrics, quality data (like unit counts), and upcoming maintenance.
A factory dashboard is an organic visual representation of real-time data collected by a machine data platform. It shows everyone across the fab how their line is performing at any given moment.
KPIs
In manufacturing, it’s vital to be able to capture useful data insights and quickly turn them into actionable information. With a factory production KPI dashboard, you can monitor key manufacturing processes in a way that’s easy to understand and use for real-time analysis.
Overall equipment effectiveness (OEE) is a manufacturing metric that measures whether machines are running at full capacity or not. This enables staff to identify and resolve machine problems quickly, boosting productivity.
Costs are another critical manufacturing metric that allows companies to see their total costs and compare them to others’ by customer, product area, and region. This enables businesses to discover where they are overpaying and take the necessary steps to reduce costs.
Finally, lead time is a measure of how long it takes for the company to fulfill consumer orders using existing product inventory. This enables companies to respond to demand promptly and increase customer satisfaction. All of these metrics can be monitored on a manufacturing production KPI dashboard with the assistance of powerbi consulting.
Dashboards
Manufacturing dashboards track the most important production KPIs in a single access point and are a valuable analytics tool for lean manufacturers to save costs by improving product quality. They’re also an excellent way to monitor a factory to detect problems and correct them quickly so that production doesn’t fall behind.
An overall equipment effectiveness (OEE) dashboard is a great example of a factory production dashboard template that provides a real-time readout of OEE parameters for multiple lines in your plant. It’s easy to see the current status of each machine in your factory and identify the root causes of downtime.
A production line dashboard can display safety information, unit counts, first-pass yield, and more. It’s a one-stop shop for production insights and can be personalized for each user, such as a VP who wants to focus on metrics that impact monthly results or a plant manager who prefers to keep an eye on daily performance with the help of insurance business intelligence.
Visualizations
For factory floor managers, it’s important to see production data as close to real-time as possible. This enables them to catch issues before they grow into problems, offer feedback to employees who need to shift their priorities to meet production targets, and spot opportunities for optimization at the line level.
A line dashboard provides a single, convenient point of access for all the manufacturing KPIs that matter to your team. At a glance, you can see the status of each machine and whether it is meeting its performance target for that day.
Power BI dashboard can show a clear breakdown of the causes of planned and unplanned downtime, so you can prioritize the most important machines. That helps you maximize your return on investment by eliminating guesswork and reducing the time lost to inefficient processes. It’s a win for your business and your employees. Insights flow from visibility, and that’s exactly what a manufacturing production dashboard offers.
Visibility
Managers need a continuous stream of high-level production information to make immediate decisions that boost output. A production performance dashboard displays a real-time view of the plant’s capacity to meet customer demand and provides insights into material procurement and planning. It also helps managers react quickly to any discrepancies between a forecast and current factory conditions, enabling them to make smart adjustments like ordering more materials or altering production expectations.
Unlike planners, technicians do not work with pre-defined metrics and need to see the most relevant data points for their job function. A technician’s dashboard may highlight machine performance, including MTBF and MTTR data, and quality data like customer complaint counts. It should also include a list of open RCA issues to track progress on fixing defects, which can improve product quality and drive revenue.
An effective manufacturing dashboard includes multiple customizable metrics that are specific to each role.
