

You know, apps are a dime a dozen nowadays. But you wanna know the real secret to making yours stand out? App metrics to track.
Yeah, it’s that digital footprint users leave behind every time they interact with your app.
Get this – every interaction, every click, every little moment someone spends on your app tells a story.
That story?
It’s the difference between knowing what your users love and, well, shooting in the dark. Dive deep into mobile app analytics, and you’ll quickly find the treasure map to your users’ hearts.
When you’re building or refining an app, it’s not just about having cool features. It’s about knowing what makes your users tick.
And for that, you gotta have your eyes on the right mobile app KPIs. These metrics, they’re the heartbeat of your app, the rhythm to your rhyme, the… you get the picture.
Acquisition Metrics
App Downloads
Oh, man! Remember the first time someone downloaded your app? Such a rush! But as they say, the first time’s a charm, and then you gotta keep up the momentum.
Trends in downloads over time (daily, weekly, monthly).
Keep tabs on these download trends. Whether it’s daily, weekly, or monthly, it’s all about spotting patterns.
Maybe there’s a spike every weekend? Or a dip during the holidays? Get into the groove and start predicting those trends.
Download Attribution: Channels users come from.
Alright, think of this as tracing back your steps to find where you dropped your keys.
Only this time, it’s about finding out which online alleyways and digital streets your users wandered from, using various influencer marketing tactics.
Was it a sizzling app store optimization (ASO) metrics post on Instagram or a cheeky tweet? By figuring out your strongest download attribution channels, you can focus your energy where it counts.
Cost Per Install (CPI) / Cost of Acquiring a Customer (CAC)
Money talks. Especially when you’re spending it to get people on your app.
Calculating CPI and its significance.
Here’s the lowdown: For every user who gets your app, there’s a price tag. That’s your CPI. It’s the breadcrumb trail of your mobile user acquisition metrics.
Low CPI? High-fives all around. High CPI? Time to rethink where you’re putting those ads.
Factors influencing CPI, such as target audience and geographical region.
Okay, so let’s get real for a second. Your CPI can sway like a palm tree in the wind.
Maybe you’re targeting just the right audience, or perhaps it’s the region you’re zooming into. Heck, even the color of your app icon can play a role (yeah, psychology’s weird).
Customer Lifetime Value (CLTV)
So, you’ve got a user. Woo-hoo! But how much are they really worth? No, not like that! I mean, over time, as they use your app, it’s crucial to measure their contribution to your marketing funnel.
Measuring the total value of a customer over their lifetime.
This isn’t just about dollars and cents. This is about understanding your user’s journey. From that first curious download to becoming your app’s BFF.
That entire journey has a value, the Customer Lifetime Value. It’s the ultimate love letter to your app’s in-app behavior tracking.
Importance of segmenting CLTV for different user segments.
Not all users are made equal. Some are casual browsers, others are power users, and then there are those who just can’t resist an in-app purchase.
So, segment ’em! Understand each group’s vibe, and you’ll have a better grasp of how to make them stick around. After all, stickiness ratio isn’t just some random metric, it’s an art.
Engagement Metrics
Man, when it comes to apps, it’s kinda like relationships, right? It’s not just about meeting someone; it’s about keeping that spark alive through mobile app analytics.
So, let’s talk about how engaged your users are.
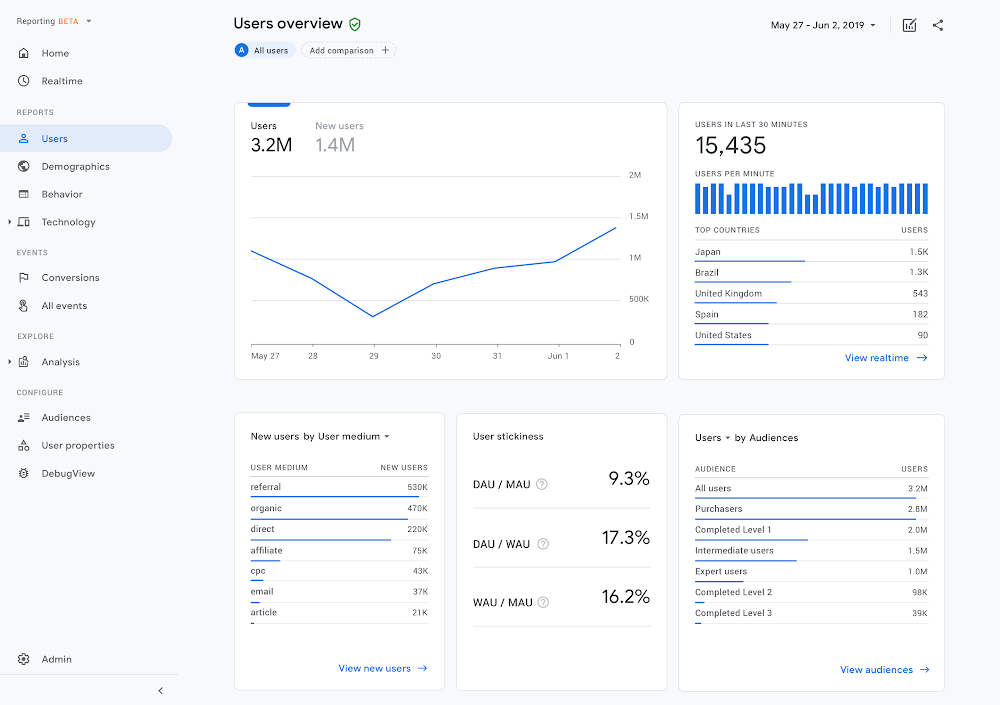
Active Users (DAU, MAU, YAU)
Imagine you throw a party every day, and you notice the same faces turning up – those are your DAU (Daily Active Users). Then there’s that monthly barbecue, with a mix of regulars and some newbies – that’s your MAU.
And, oh, the annual mega bash? Yeah, that’s the YAU territory. What’s it all mean? It’s all about keeping track of who’s dancing to your app’s tunes and when.
Significance of DAU in measuring app engagement levels.
DAU is kinda like your pulse rate for app health. If you’ve got users coming back every day, it’s like a daily dose of app love. More DAUs? More love. Simple.
Session Length
Factors influencing session length, such as app type and user demographics.
Alright, so session length is like how long someone hangs at your party. Some might bounce after a song, while others stay till dawn. It could be the type of music (read: app type) or the crowd (hello, user demographics). Wanna make them stay longer? Read the room and tweak the playlist.
Comparing session lengths across different app categories.
Some parties, like meditation apps, are slow burns. Others, like games, can be fast and furious.
So, it’s a bit apples and oranges when comparing session lengths. But do it anyway. Get that intel and know where you stand.
Screenviews
Insights into user interaction with the app.
Screenviews, right? It’s kinda like peeking into which rooms of your house guests hang out in the most. The kitchen? The game room?
Each screenview tells you where the action is and where it’s… well, not.
Identifying frequently used features and areas of improvement.
Oh, everyone’s hanging out by the snack bar? Maybe add more dips. No one’s using the pool? Maybe it’s time for a revamp.
Same with your app. See where the traffic’s at and jazz up the lesser-traveled paths.
Conversion Metrics
Now, let’s switch gears a bit. It’s cool to have users, but what’s cooler? Getting them to do what you want them to, be it signing up, buying something, or sharing with friends.
Conversion Rates
App store listing conversion rate.
Imagine this: you’re handing out flyers for your party. How many folks take a flyer and actually show up?
That’s your conversion rate, but for your app. And yeah, those app store optimization (ASO) metrics? They’re the spicy salsa to your chips.
In-app conversion rates for apps with free trials or freemium models.
Got a kickass free version of your app and hoping people will upgrade? That’s the dream, right?
Check out who’s making the leap from free guest to VIP. That freemium conversion metric is your golden ticket.
Goal Completion & Time to Goal Completion
Monitoring user actions leading to desired outcomes.
It’s like setting up a treasure hunt. You’ve got clues (features) that lead to a treasure (user’s goal).
But how smooth is their journey? Are they finding the treasure, or getting lost midway?
Importance of A/B testing and customizing app store listings.
Ever try two different outfits and ask a friend which looks better? That’s A/B testing but for your app.
Little tweaks can make a big splash. Keep experimenting, and soon you’ll have that killer look (or app version)!
Retention & Churn
Okay, picture this: You’ve thrown a party. But how many people actually stay till the end? Or, better yet, come back for your next one?
Retention Rate
Factors affecting retention rates, such as user interface.
You ever use an app and think, “Why is this so complicated?” or “Man, this is so smooth!” That’s the user interface right there.
If your app is a maze, people will drop out. But if it’s a slide? Whee! Down they go, having fun all the way. It’s one of the major app metrics to track if you’re serious about keeping users.
Strategies to boost retention and user loyalty.
It’s like that favorite hangout spot you keep going back to. Why? The vibe, the people, the rewards? Apps are no different.
Reward users with cool stuff. Throw in some personalization – maybe a “Missed you” or “Check out what’s new”. Make ’em feel at home.
Churn Rate & Subscription Churn Rate
Understanding the percentage of lost subscribers.
It’s a bummer, but not everyone who subscribes will stick around. Think of it as friends who drift apart.
Maybe they found a new hangout or maybe your hangout changed. It’s essential to keep an eye on these numbers, especially if you’ve got a subscription model.
Strategies to reduce churn and improve user satisfaction.
Got feedback? Use it. People leaving? Find out why. Maybe it’s a bug, or maybe they want a feature you haven’t thought of.
Dive deep, tweak, and iterate. The goal? Make your app their forever home.
Performance Metrics
Alright, let’s shift gears. Now, imagine using an app that’s slower than a snail or one that crashes every two minutes.
Frustrating, right?
App Load Time & Latency
Importance of optimizing app load times for better user experience.
You wouldn’t like waiting in a long line just to get into a party, would you? Same with apps.
If they take forever to load, bye-bye user! It’s like the first impression. Quick, smooth entry? Win. Lags and delays? Not so much. It’s an app metric to track that’s often overlooked but super crucial.
Monitoring app latency and its impact on user engagement.
It’s not just about the load time. How quickly does the app respond when you’re using it? That’s latency for you.
Keep it low, and you’ll have users dancing to your tunes. High latency? Expect some groans and exits.
App Crashes
Addressing and reducing app crashes for enhanced user satisfaction.
Imagine if the music at your party suddenly stopped. Buzzkill, right? App crashes are like that.
The last thing you want is for users to be in the middle of something and boom, the app’s gone. Address it, stat!
Importance of regular updates and bug fixes.
You wouldn’t wear the same outfit to every party, would you? Change it up! Update, refresh, and more importantly, fix what’s broken.
Listen to feedback, iron out those wrinkles, and keep your app looking fresh and glitch-free. It’s like keeping the vibe alive and kicking!
Revenue Metrics
Bingo! You’ve got people coming to your party (or, you know, app), and they’re having a good time. But hey, there’s no harm in making a few bucks along the way, right?
Average Revenue Per User (ARPU)

Imagine you throw a party, and you charge an entrance fee. Now, not everyone will buy the VIP pass or even a drink, but some might go all out.
The money you make divided by the number of guests? That’s your ARPU.
It tells you how much each user is worth, and it’s a massive app metric to track. More bucks per user? You’re doing something right.
Strategies to boost ARPU and monetize the user base effectively.
Mix it up a bit! Maybe offer some premium features? Or a cool in-app purchase that’s too tempting to resist? Heck, throw in a limited-time offer.
Make them feel they’re getting more bang for their buck. Cha-ching!
Freemium Conversions
Converting free users to paying customers.
You know those peeps who come for the free food but end up buying a drink or two? That’s your goal. Give ’em a taste, and they’ll want the full course.
It’s all about showing them what they’re missing out on.
Average conversion rates and strategies to improve them.
So, how many from the “free food” gang end up at the bar? If that number’s low, you might wanna rethink your strategy.
Maybe offer a discount on the first purchase? Or show off those exclusive features a bit more? It’s all about the tease.
User Engagement Insights
Alright, so now you’re making some money. But what about the vibes? Are people enjoying themselves? Are they coming back?
Stickiness Ratio
Measuring user engagement and return rates.
Okay, think of stickiness like the number of people dancing non-stop at your party. If they’re grooving continuously, they’re loving it.
If they’re sitting most of the time, maybe change the track? Stickiness tells you how often users come back to your app. It’s all about keeping the party going!
Factors influencing stickiness and strategies to improve it.
Maybe it’s the music, the crowd, or those rad lights? Find out! Is there a feature they love? Highlight it. Something they’re not using?
Maybe a quick tutorial or a pop-up hint could help.
User Feedback & Reviews
Importance of user feedback in app improvement.
Dude, feedback is like gold! It’s like your friends telling you what they loved about your party and what was a bit “meh.”
Listen, adapt, and make it even better next time. Every piece of feedback is a chance to level up.
Addressing user concerns and enhancing app features based on feedback.
Someone didn’t like the drinks? Get a new mixologist. Someone raved about the DJ? Book ’em for the next one.
Similarly, with apps, if a feature’s causing trouble, fix it. Got a rave review about a feature? Double down on it. It’s all about giving the users what they want. Because happy users = party success. And yeah, app metrics to track help a ton in this.
FAQ On App Metrics To Track
What exactly are app metrics?
Well, let me break it down for you, pal. Think of your app as a machine. You need some gauges and indicators to see how it’s running, right?
That’s where app metrics to track come into play.
They’re like the dashboard of your car, showing you speed, fuel, and all that jazz.
In the app world, these metrics might tell you how many folks are using your app, for how long, and what they’re up to. It’s your peek behind the curtain.
Why are they important?
Imagine throwing a party but being locked in a room without seeing or hearing the guests. Not ideal, huh?
App metrics are your eyes and ears. They help you figure out if people are dancing to the music or if they’ve bailed.
In the digital space, it’s about knowing user engagement, retention, and all that juicy stuff. If you’re in the dark, you can’t fix what’s broken or amp up what’s rocking.
How often should I check these metrics?
This one’s a bit like asking how often you should check your plants. Some need daily water, others weekly.
Similarly, some app metrics need daily monitoring (like crashes or performance issues), while others, like user acquisition, might be a weekly or monthly peek.
The key? Consistency. Just like you wouldn’t want your plant to wilt, you wouldn’t want your app’s performance to droop either.
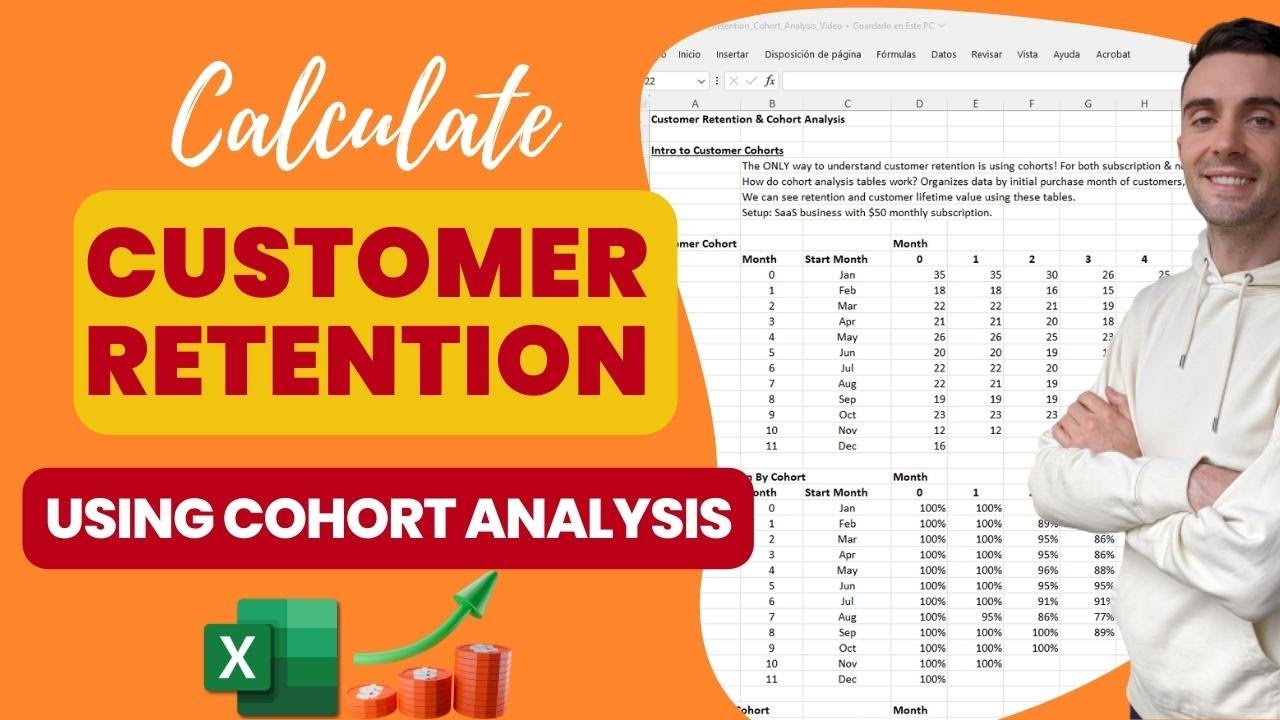
What’s the deal with retention rates?
Ah, retention rates. It’s all about the stickiness, my friend. Let’s say you’ve got this killer new cafe in town.
If folks come once and never return, that’s a bummer, right? Retention rate in the app world is kinda the same.
It measures how many folks keep coming back to your app after the first time. High retention? You’re the popular joint. Low retention? Might be time for a rethink.
Are all metrics equally crucial?
Great question! Well, not all metrics wear capes. Some are superheroes, while others are sidekicks.
For instance, user engagement or churn rate could be your Superman or Wonder Woman, telling you the big picture.
But then you’ve got metrics like screenviews which might be more of a Robin – important, but not always the star of the show. Prioritize based on your app’s goals.
What’s this I hear about “Average Revenue Per User”?
Alright, money talk! ARPU, or Average Revenue Per User, is all about the green. It tells you, on average, how much moolah each user is bringing in.
So if you’re trying to figure out if your app’s making bank or just some spare change, ARPU’s your go-to metric. Whether you’re selling items, services, or have in-app purchases, this guy helps you see the financial big picture.
How do I boost my app’s metrics?
It’s like tuning a guitar. First, you need to know which strings (or metrics) are off. Once you’ve got a grasp on your performance metrics, user feedback, and the likes, then it’s tweak time.
Maybe your app crashes a lot or takes ages to load.
Perhaps your user interface is confusing folks. Identify, adjust, and keep that cycle rolling. It’s all about fine-tuning.
Why do some apps track screenviews?
Peeking into screenviews is like seeing which rooms in a house get the most visits. Are folks chilling in the living room or hanging out in the kitchen?
With apps, screenviews tell you which parts are getting the love and which ones, well, not so much.
It’s super handy for figuring out popular features or spots that might need a little sprucing up.
How do freemium conversions work?
Picture this. You’ve got this shiny toy store. But you let folks play with some toys for free. Now, if they want the super cool toys, they gotta pay. That’s the freemium model.
The transition from playing for free to paying? That’s the freemium conversion.
For apps, it’s about converting those free users to premium (read: paying) ones. It’s a dance between offering value and enticing upgrades.
Can metrics help improve my app’s design?
Oh, absolutely! Think of metrics as feedback. If your user engagement is low or folks are dropping off quickly, maybe they’re not vibing with your design. Metrics like user feedback, session lengths, and churn can give you hints.
Too many crashes? Maybe there’s a design flaw. A feature not getting clicks? Maybe it’s not intuitive. It’s all about reading between the lines and jazzing things up.
Conclusion On App Metrics To Track
So, we’ve journeyed through the ins and outs of this party, aka our app. Remember when we started? It felt like trying to set up a killer playlist. But now? We’ve got the beats, the crowd, and the energy!
Imagine you’ve thrown the ultimate party. People are dancing, laughing, and having the time of their lives. But what if the music stops? Or the lights go out? Kinda ruins the mood, right? That’s what happens if you ignore those app metrics to track. They’re your DJs, your light controllers. They keep the energy flowing.
You gotta keep an eye on them. Consistently. Like, you can’t just drop a banger track and walk away. What if the next song’s a dud? You have to be ready to switch it up.
Metrics, like your daily active users, retention rates, and yep, even that complicated sounding user acquisition cost, are your app’s pulse. They show you where the party’s popping and where it’s, well, flopping.
Alright, real talk. These metrics? They’re more than just numbers on a dashboard. They’re stories. They tell you who’s loving your app, who’s kinda meh about it, and where the money’s flowing (or not).
Want to grow? Metrics are your map. They show you which paths are golden and which are dead ends. User satisfaction? That’s the heart of your app. If they’re happy, you’re golden. And if not? Well, metrics tell you where you goofed up.
And cash? Oh, don’t even get me started. We’re all in it to create something cool, but hey, a little moolah on the side never hurt. Knowing your average revenue per user or how often your freemium users are upgrading? That’s your ticket to making it rain.
If you enjoyed reading this article about app metrics, you should read these as well:
- Want to Hire a Web Development Team? Know This First
- Product manager vs project manager: The difference between them
- Top fintech apps that will make a splash this year
- The Most Expensive App Store Apps To Know Of
With over a decade in the tech field, Bogdan blends technical expertise with insights on business innovation in technology.
A regular contributor to TMS Outsource's blog, where you'll find sharp analyses on software development, tech business strategies, and global tech dynamics.
- Design’s Descent: What Happened to Fab? - April 19, 2024
- Design Basics: iPhone App Icon Size Requirements - April 19, 2024
- Quick Guide For Developing Mobile Games - April 18, 2024